
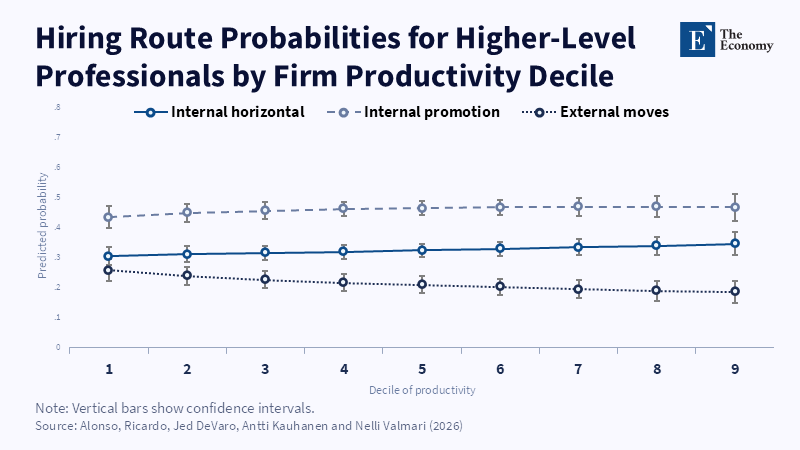
Figure 1: External hiring of professionals drops from about 26 percent to 19 percent in more productive firms, while internal promotion stays near 45 percent.
Read More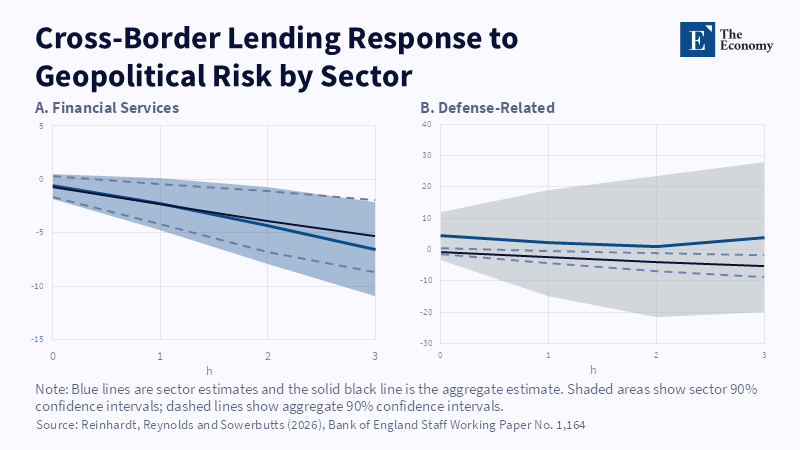
Figure 1: Lending to financial firms keeps falling across the horizon, while defence-related lending shows no clear decline. Related article:
Read More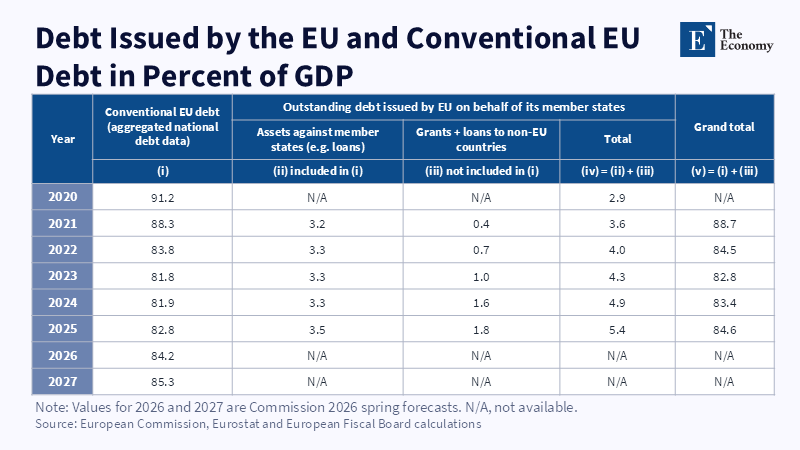
Figure 2: EU-issued debt rose from 2.9 percent to 5.4 percent of GDP between 2020 and 2025, lifting the comprehensive measure 1.8 points above the conventional one.
Read More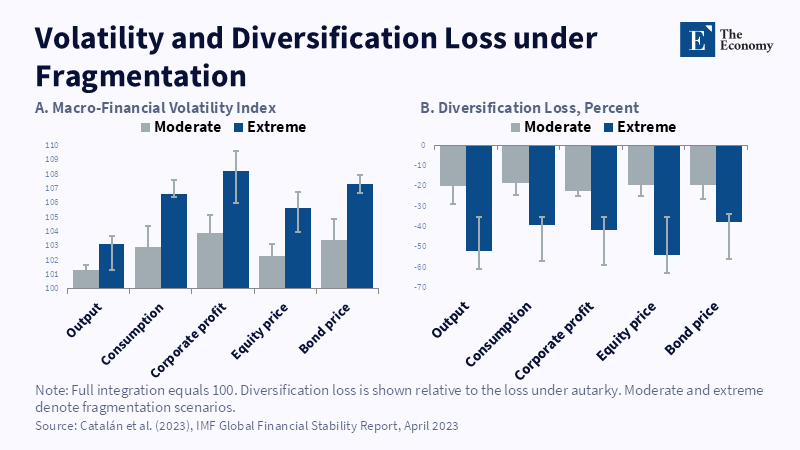
Figure 2: Extreme fragmentation raises volatility by up to about 8 points and diversification losses reach 38 to 54 percent of the autarky loss. Related article:
Read More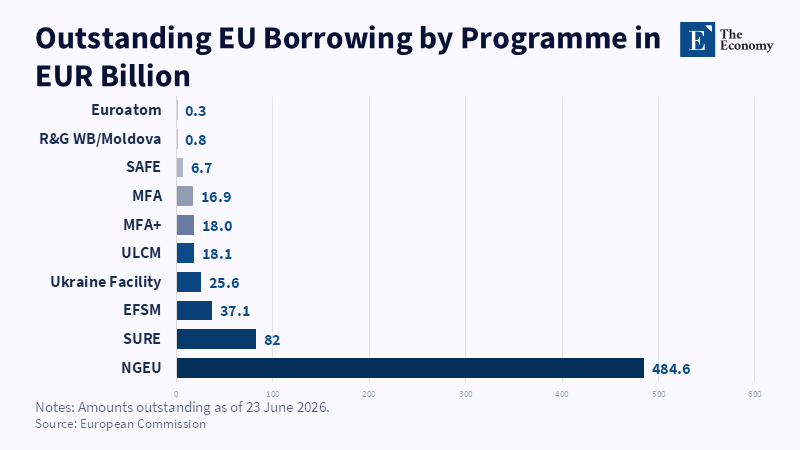
Figure 1: NextGenerationEU makes up about 70 percent of the €690.5 billion outstanding, far ahead of SURE and SAFE. Related article:
Read More







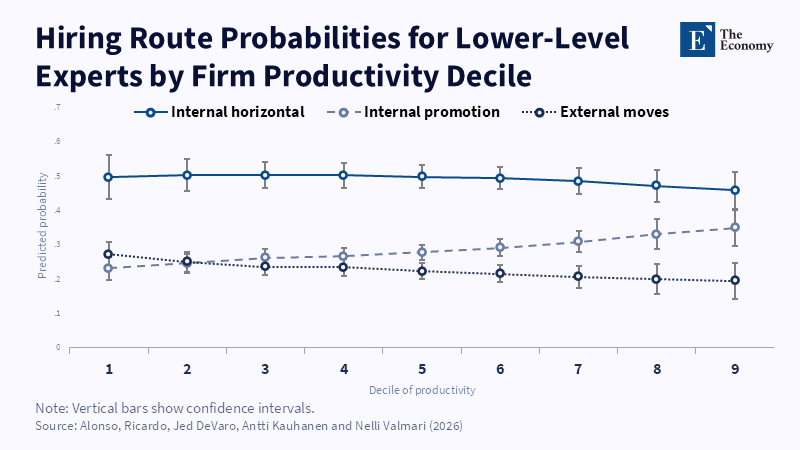
Figure 2: For lower-level experts, internal promotion climbs from about 23 percent to 35 percent and overtakes external hiring by the third decile.
Read More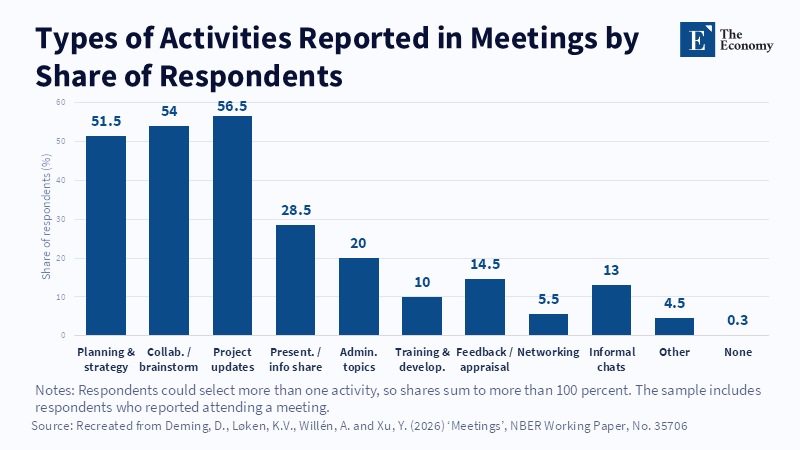
Figure 1: Planning, collaboration and project updates dominate workplace meetings. Related article:
Read More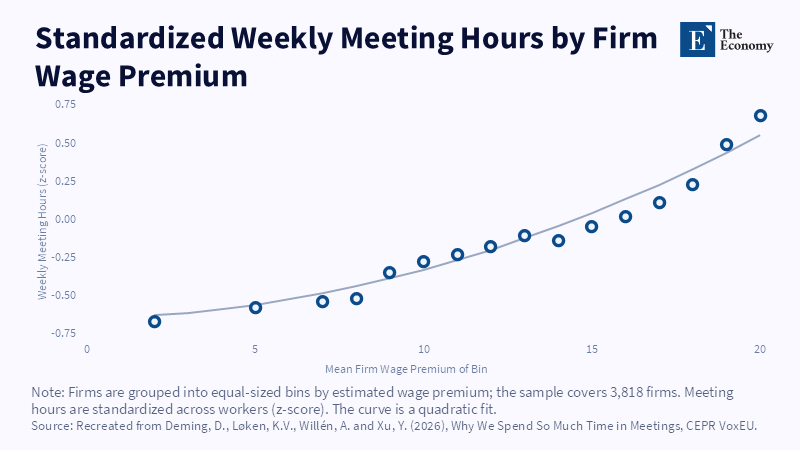
Figure 2: Firms with higher wage premia tend to report more weekly meeting time. Related article: W
Read More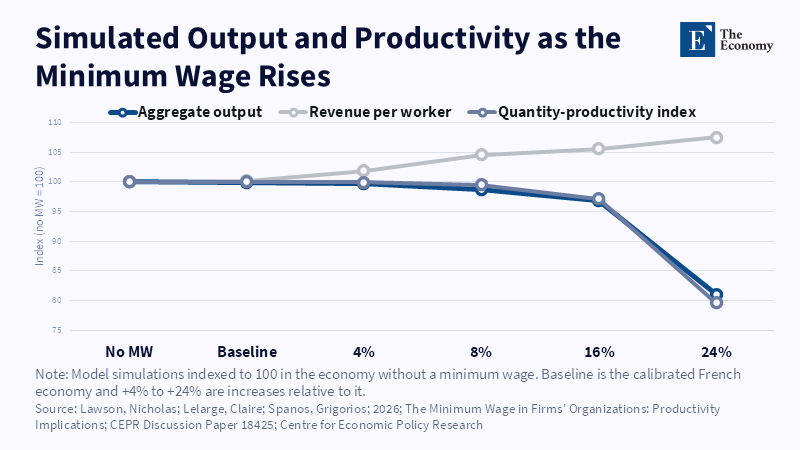
Related article: Minimum Wage Effects: The Hidden Costs Inside Firms
Read More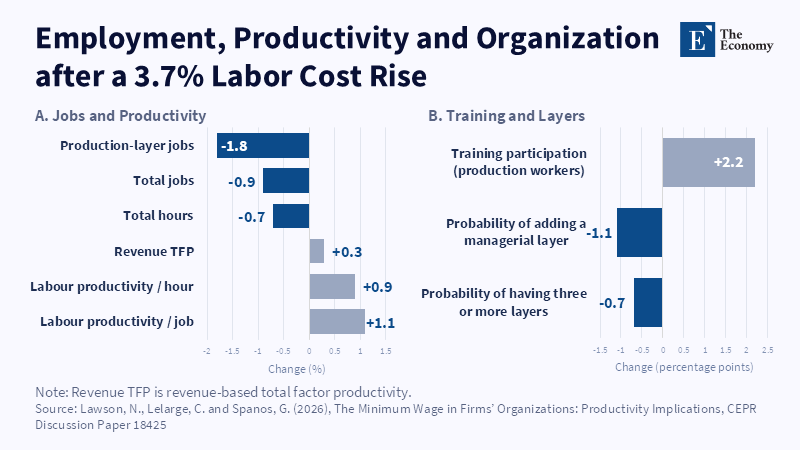
Related article: Minimum Wage Effects: The Hidden Costs Inside Firms
Read More
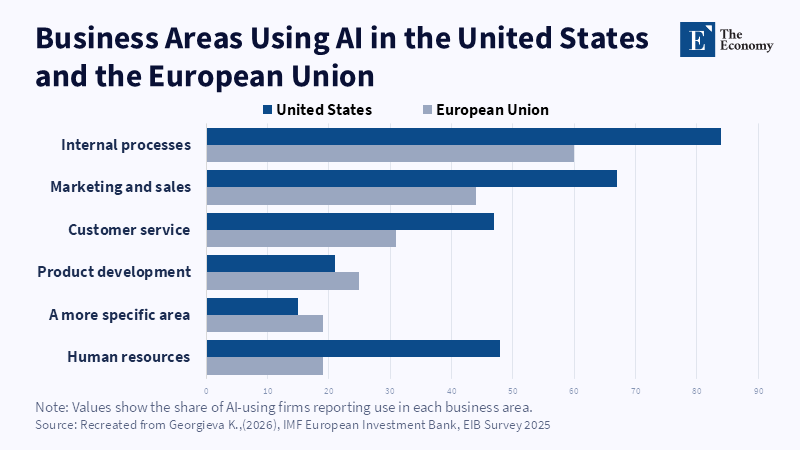
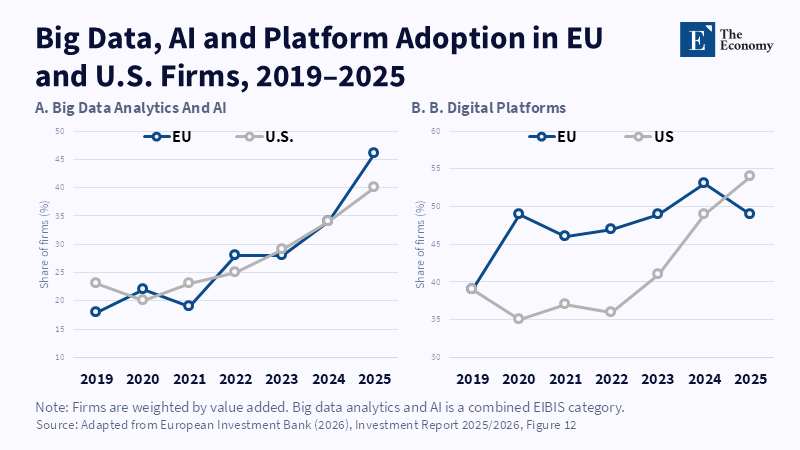
Figure 1: EU and U.S.
Read More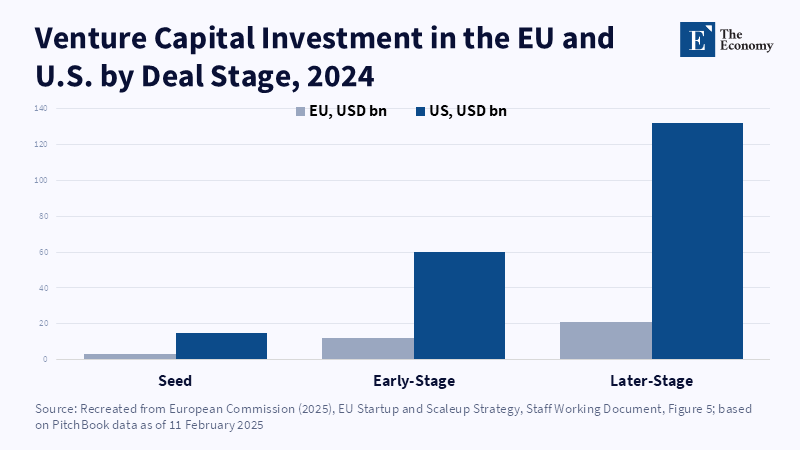
Figure 2: The EU funding gap remains substantial across growth stages. Related article: Europe Joined
Read More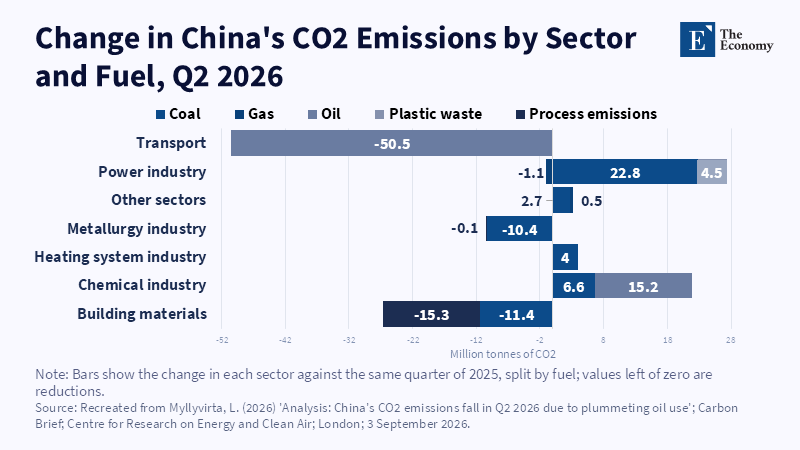
Related article: China and Fossilflation: How Renewables and Coal Kept Rates Still
Read More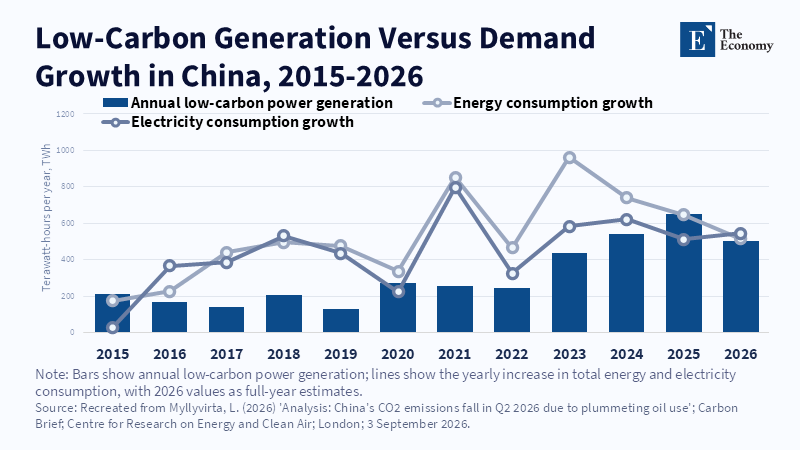
Figure 2: Low-carbon generation now nearly matches yearly growth in power demand. Related article: China and
Read More
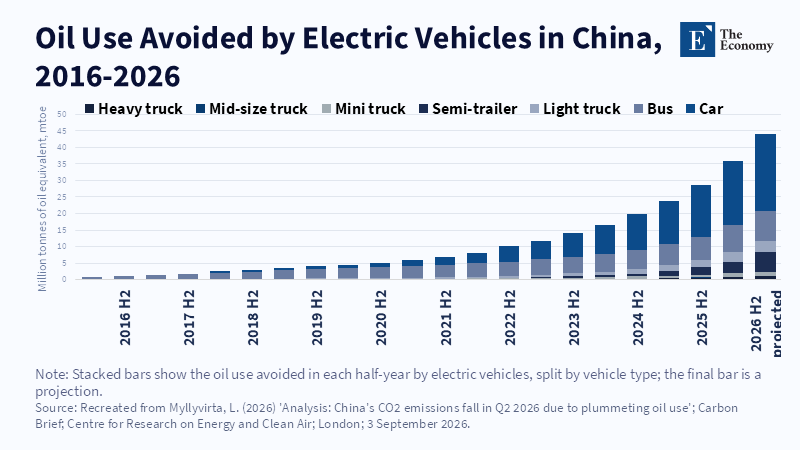
Figure 1: Electric vehicles now displace oil at a pace that doubles every two years. Related article: China a
Read More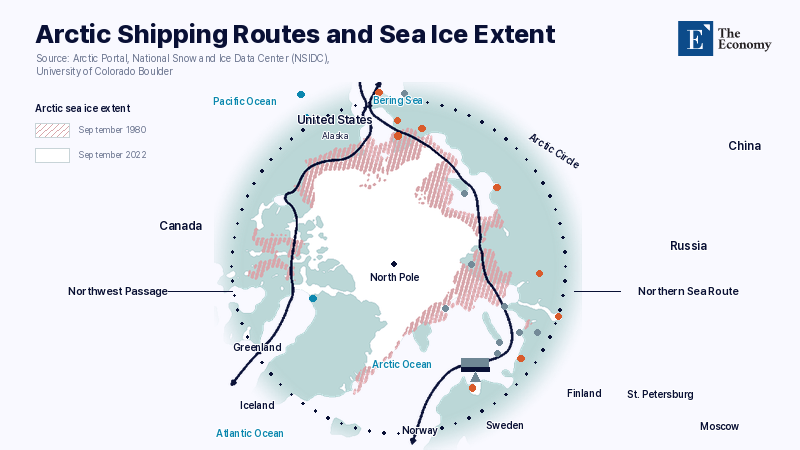
Related Articles: “Divided by Tariffs, United in the Arctic”: China-Russia Alignment Draws North America Together as U.S. and Canada Drill to Accelerate Bering Sea Interceptions | News — The Economy
Read More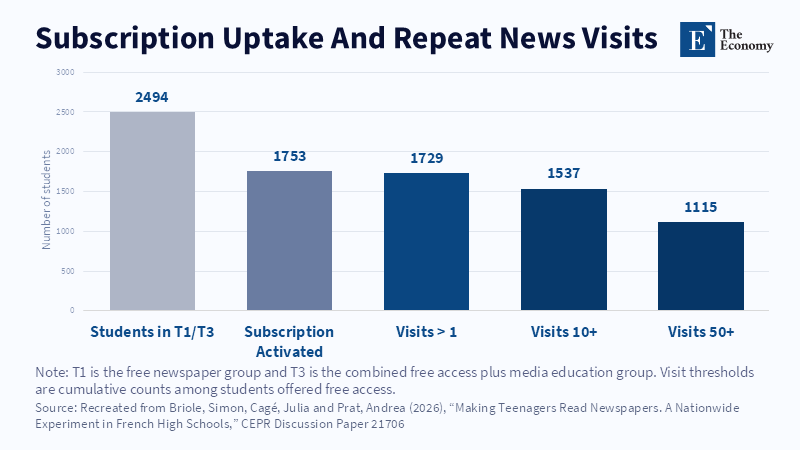
Figure 1: Repeated visits show measurable engagement beyond reported interest. Related article: Ma
Read More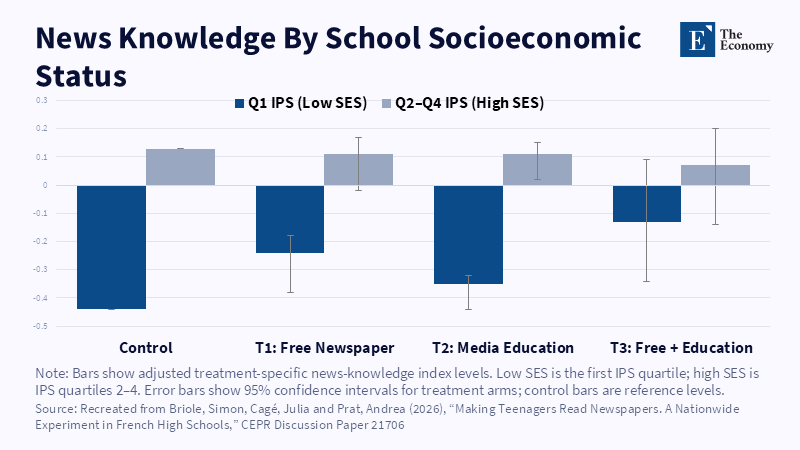
Figure 2: Knowledge gains were concentrated in lower-SES schools. Related article: Making Teena
Read More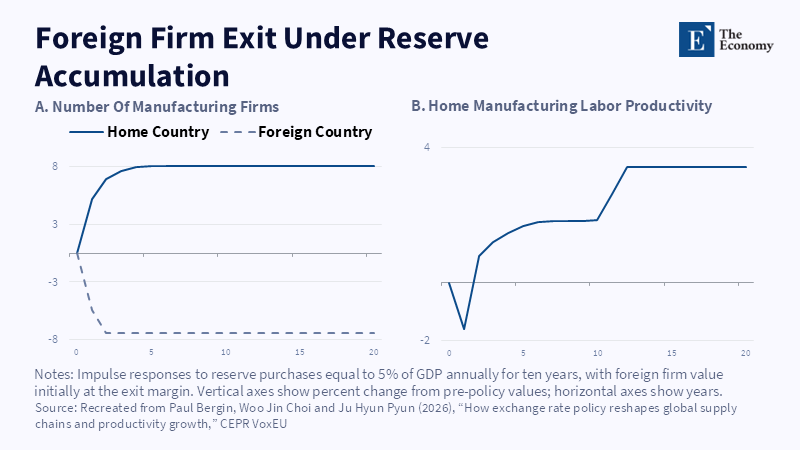
Figure 2: Persistent reserve accumulation can expand domestic manufacturing while foreign firm exit becomes difficult to reverse. Related article:
Read More