
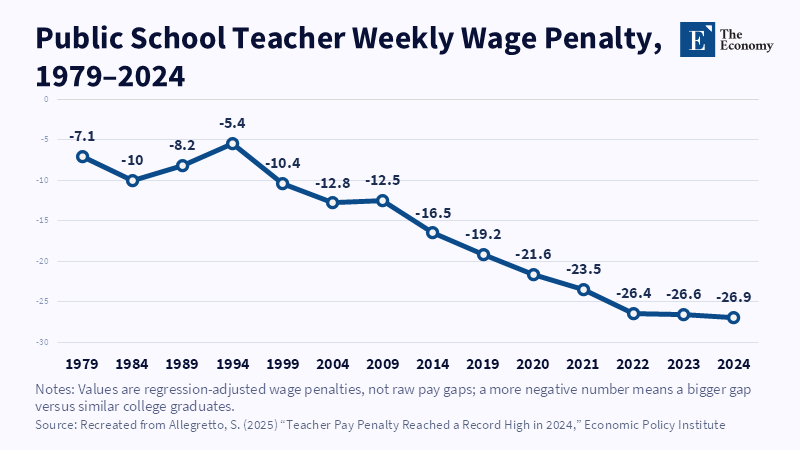
Figure: The gap between teacher pay and comparable college-graduate pay has widened almost every decade since the mid-1990s, hitting a record 26.9 percent in 2024. Related Articles:
Read More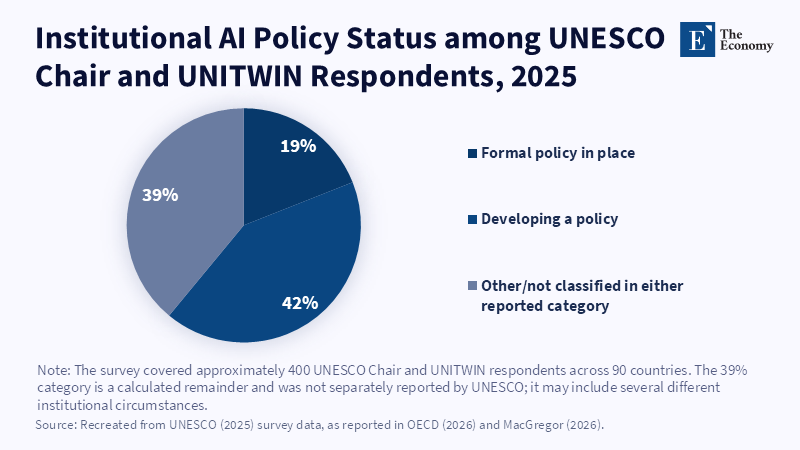
Figure: Policy development is common, but completed institutional policy remains the minority. Related Articles: AI in Higher Education: Why Univ
Read More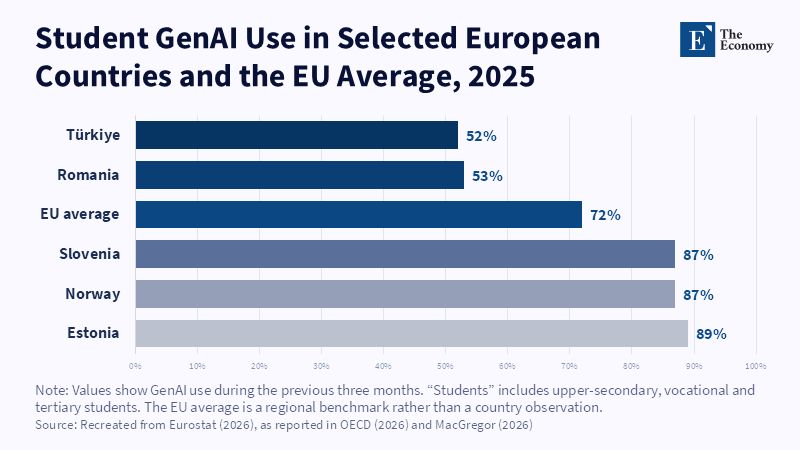
Figure: Adoption is widespread but uneven, with a 37-point gap between Estonia and Türkiye. Related Articles: AI in Higher Education: Why Univers
Read More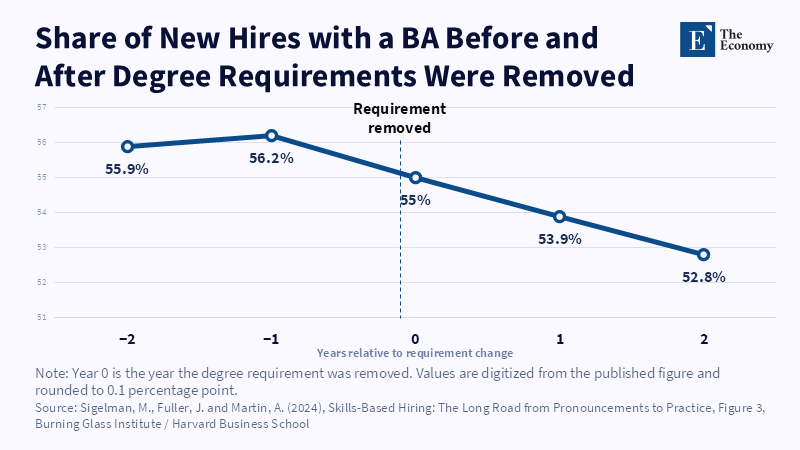
Note: The share of BA holders among new hires changed only modestly after degree requirements were removed. Related Articles: Superhuman Labor and the New Mean
Read More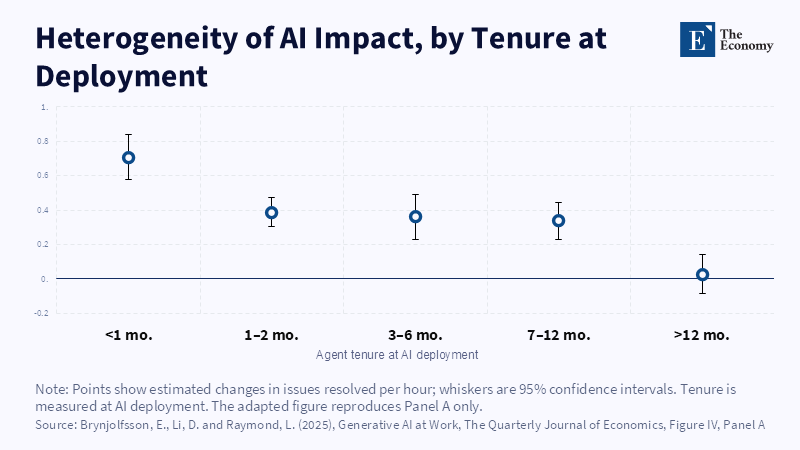
Note: AI produced the largest productivity gains among newer workers, with little measurable effect after a year of tenure. Related Articles: Superhuman Labor
Read More







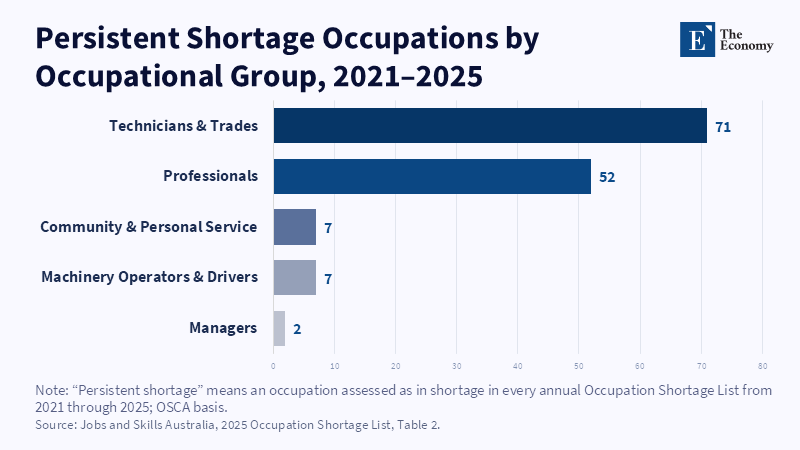
Note: Technicians, trades and professional occupations account for 123 of the 139 persistent shortages. Related Articles: Australian Student
Read More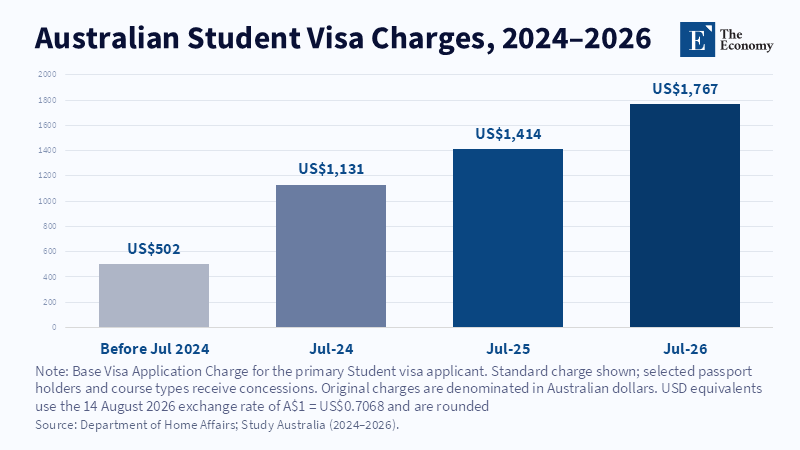
Note: The standard student visa charge more than tripled between 2024 and 2026. Related Articles: Australian Student Visa Fees Are Pricing Out
Read More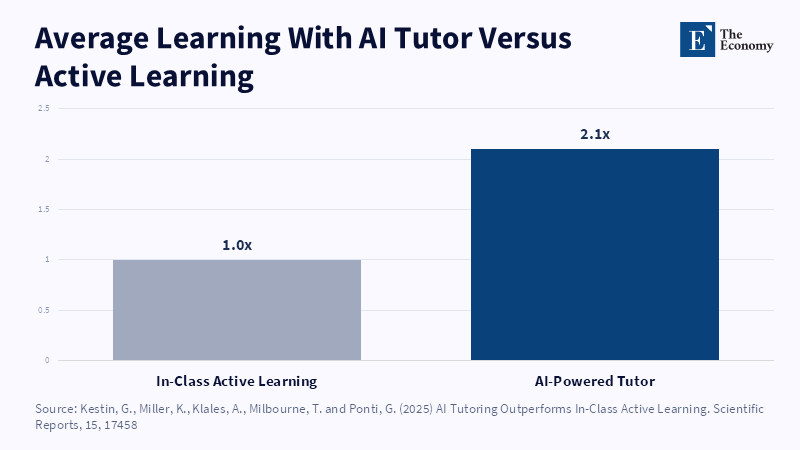
Note: A stronger result for the AI tutor than for the classroom but the gain shrinks once a plain non-AI active-learning comparison enters the picture. Related Articles:
Read More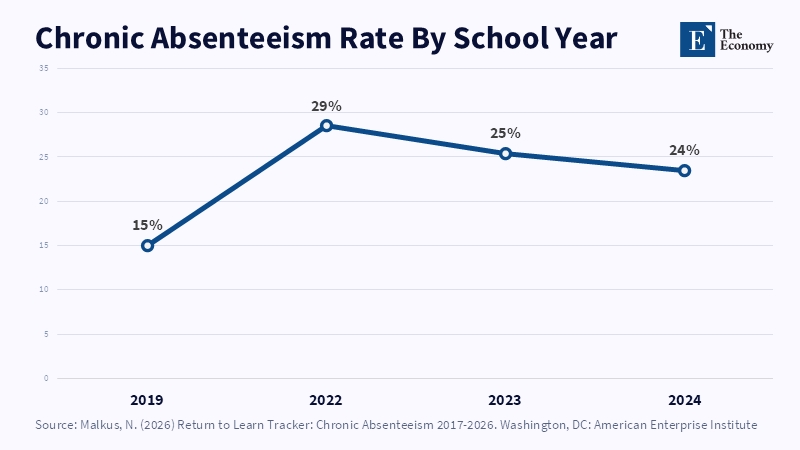
Note: Absenteeism never returned to its pre-pandemic floor, the backdrop against which Alpha School frames its case for AI-led instruction. Related Articles:
Read More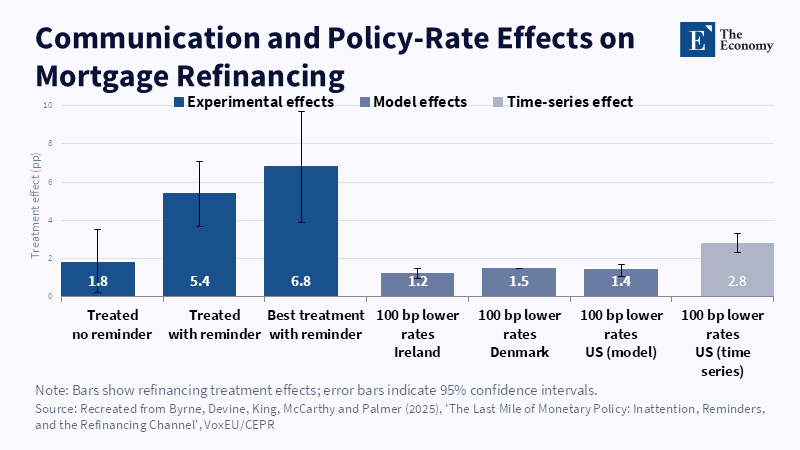
Figure 1: A reminder letter more than tripled the base treatment effect, rivalling the pull of a full percentage-point rate cut in comparable markets. Related article:
Read More
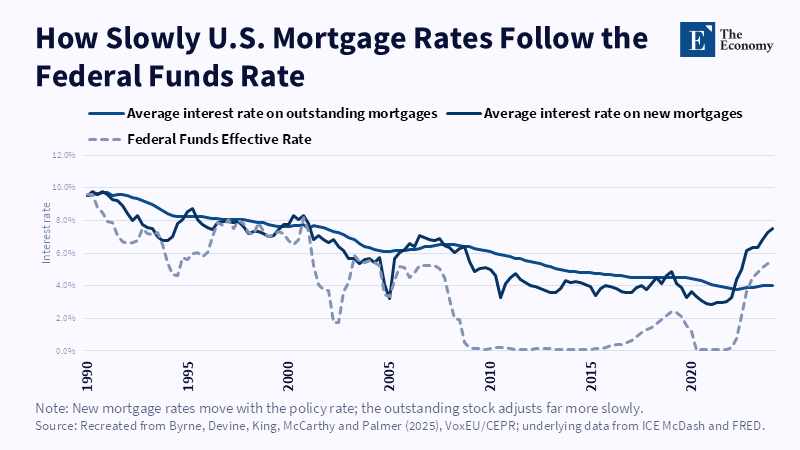
Figure 2: New mortgage rates track the federal funds rate closely; the outstanding stock adjusts far more slowly and with a lag of years. Related article:
Read More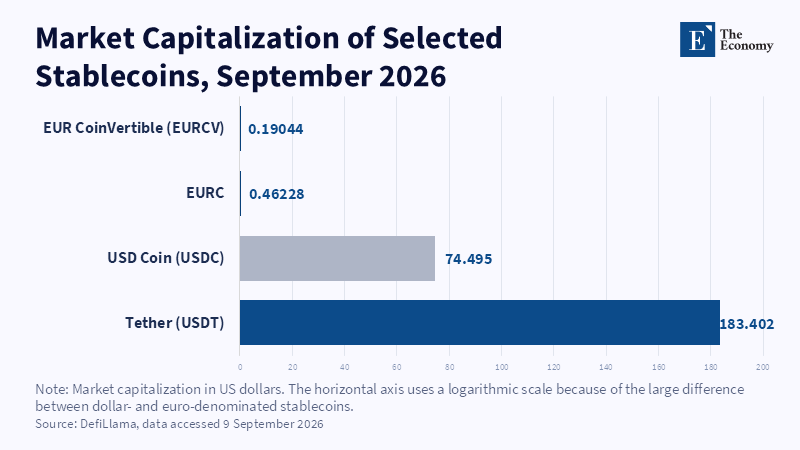
Figure 2: MiCA's redemption promise leaves the EU issuer as the only fixed point when outflows accelerate. Related article:
Read More
Figure 1: Even after MiCA's compliance boost, dollar-pegged stablecoins outweigh their euro counterparts by roughly 400 to 1. Related article:
Read More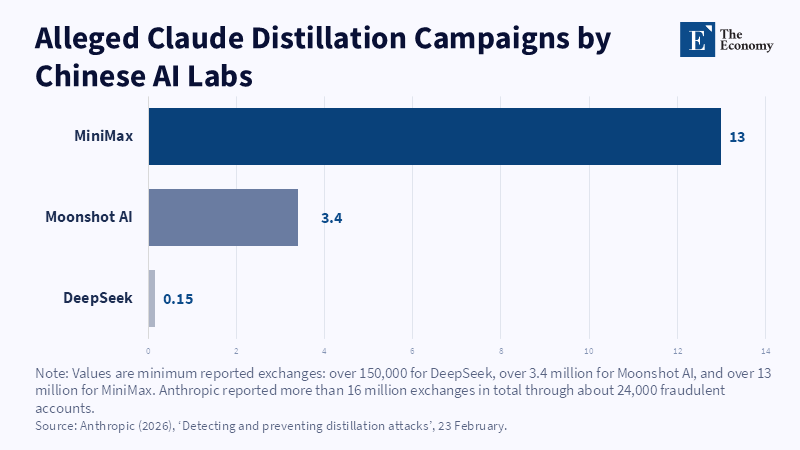
Figure 2: MiniMax accounted for nearly four-fifths of the exchanges Anthropic attributes to distillation, dwarfing Moonshot's and DeepSeek's shares. Related article:
Read More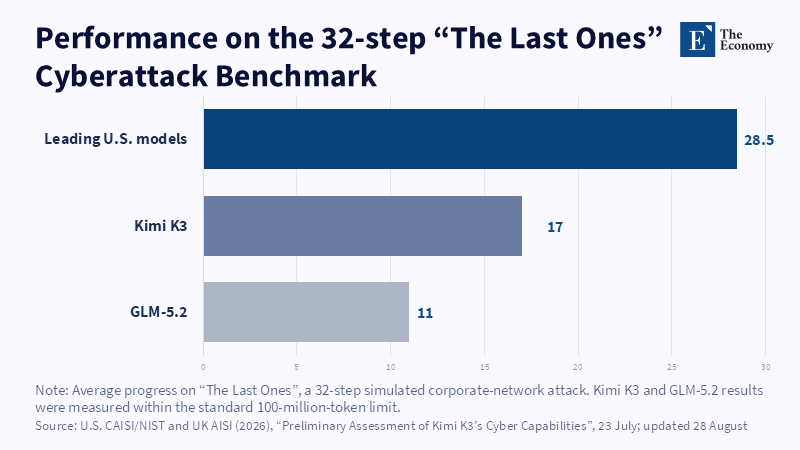
Figure 1: On a 32-step simulated attack, Kimi K3 completed barely six of every ten steps the leading US models did. Related article:
Read More
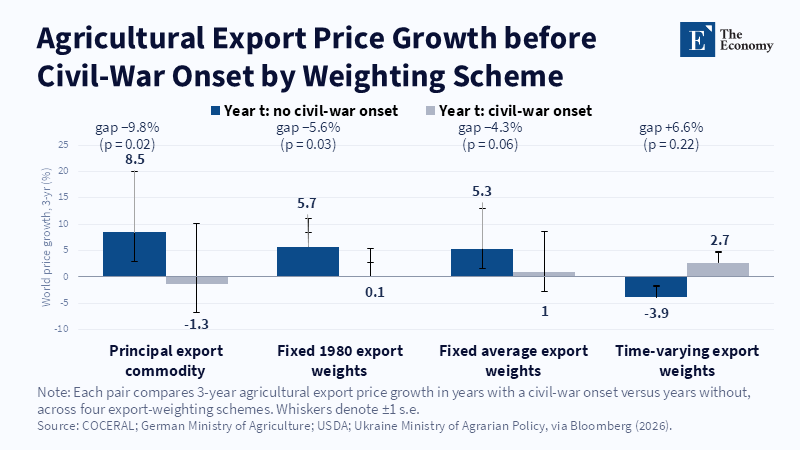
Figure 1: Prices tend to rise before peaceful years and stall or reverse before conflict. Related article: G
Read More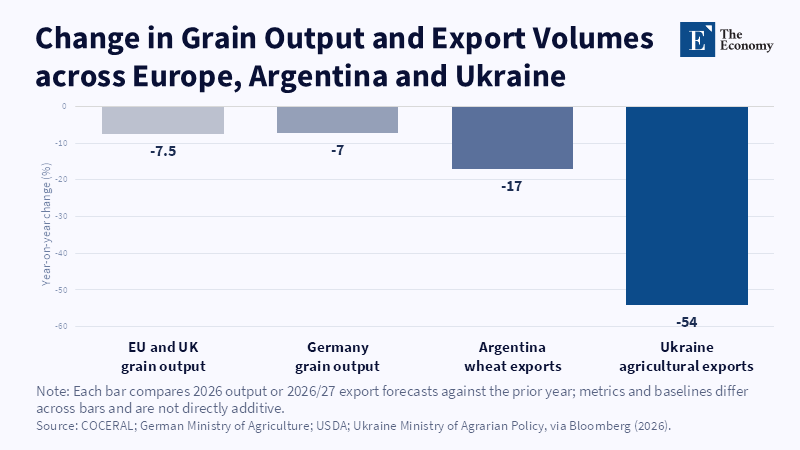
Figure 2: Three exporters' supply retreats at once, not one at a time. Related article: Grain Prices in E
Read More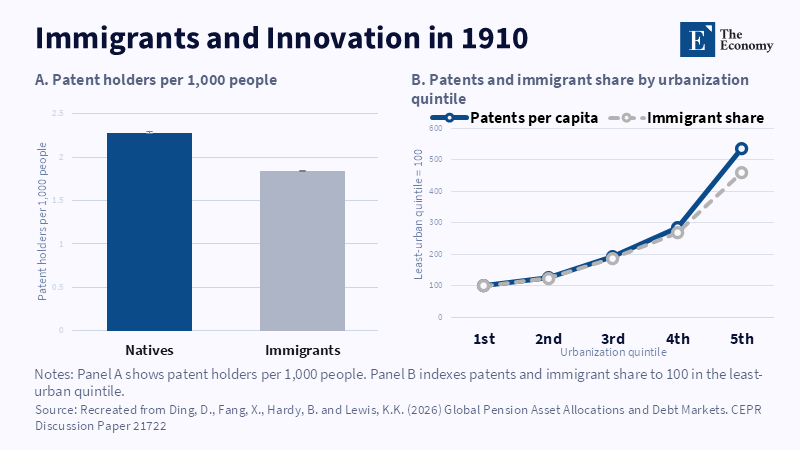
Figure 1: Patenting and immigrant concentration rose with urbanisation. Related article: Migration an
Read More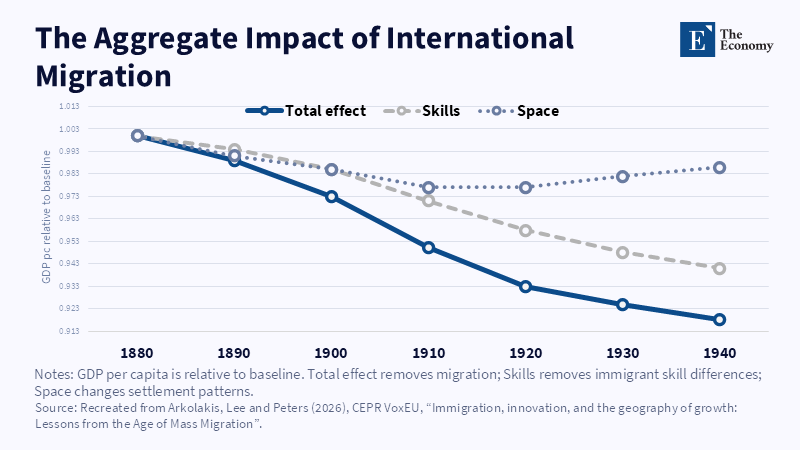
Figure 2: Skills account for most of the modeled GDP effect. Related article: Migration and Econom
Read More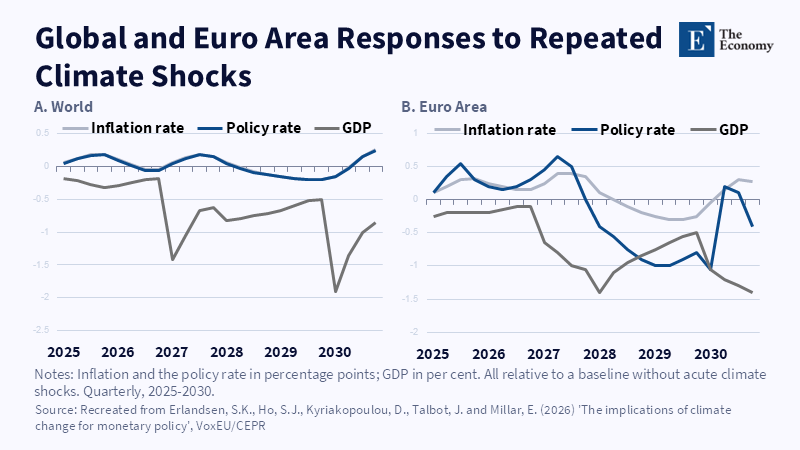
Figure 1: Euro area GDP falls sharply in the model's El Niño years, 2027 and 2030, while inflation and the policy rate move the other way; the world follows the same pattern on a smaller scale.
Read More