
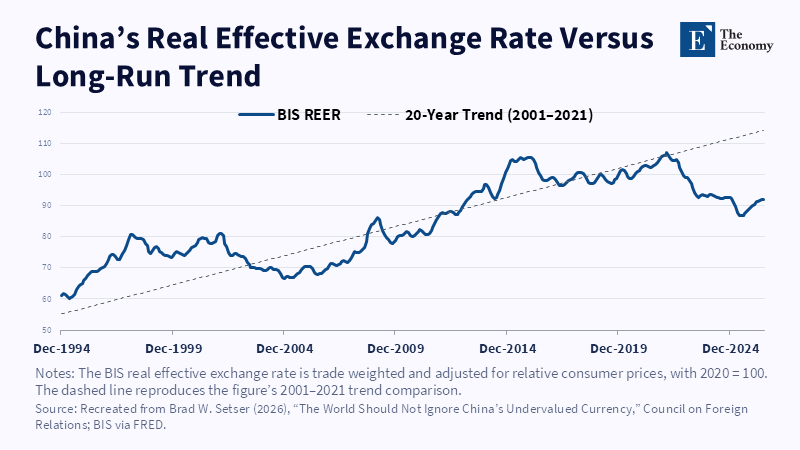
Figure 1: China’s real exchange rate remains well below its long-run trend. Related article:
Read More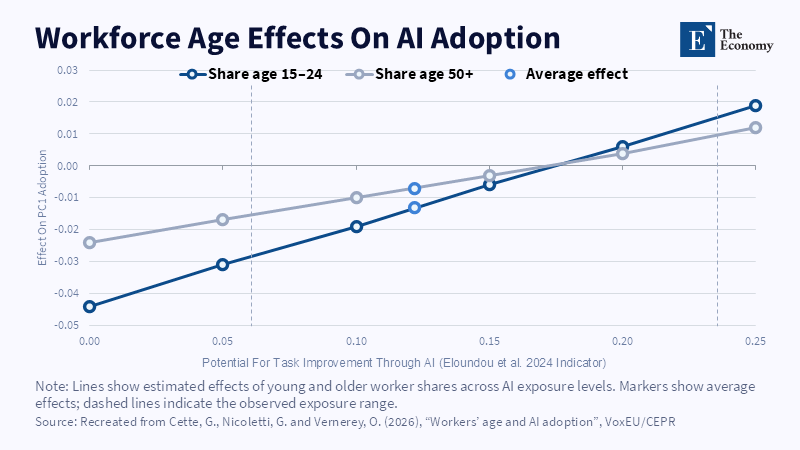
Figure 1: Higher AI exposure changes how workforce age relates to adoption. Related article:
Read More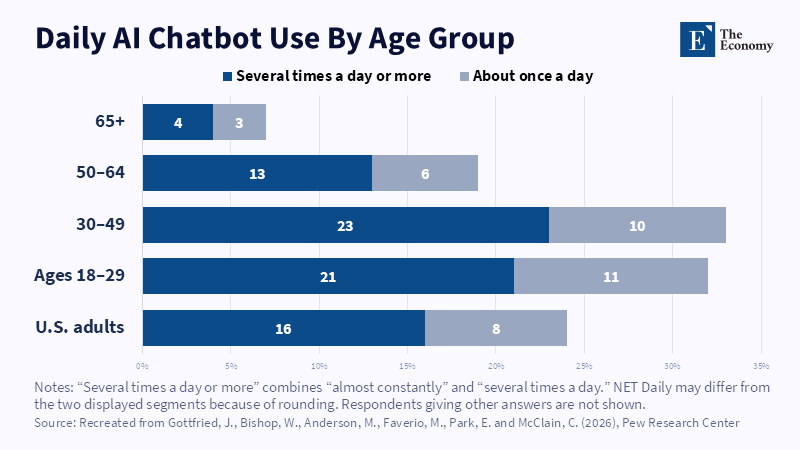
Figure 2: Daily chatbot use is highest among younger working-age adults. Related article: Age and AI Adoption:
Read More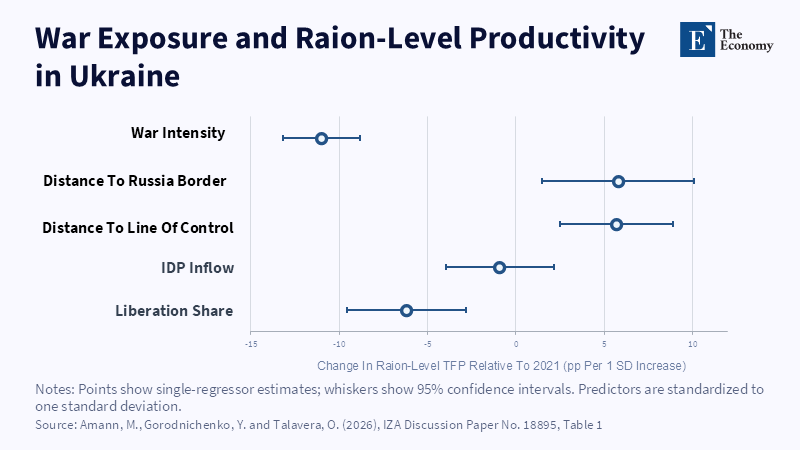
Figure 2: Local productivity losses track attack intensity more than distance. Related article:
Read More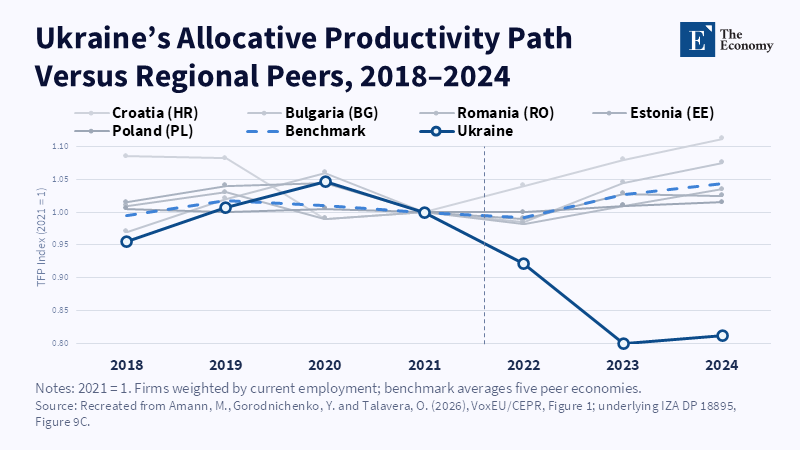
Figure 1: Ukraine’s allocative productivity diverged sharply from regional peers after 2021. Related article:
Read More







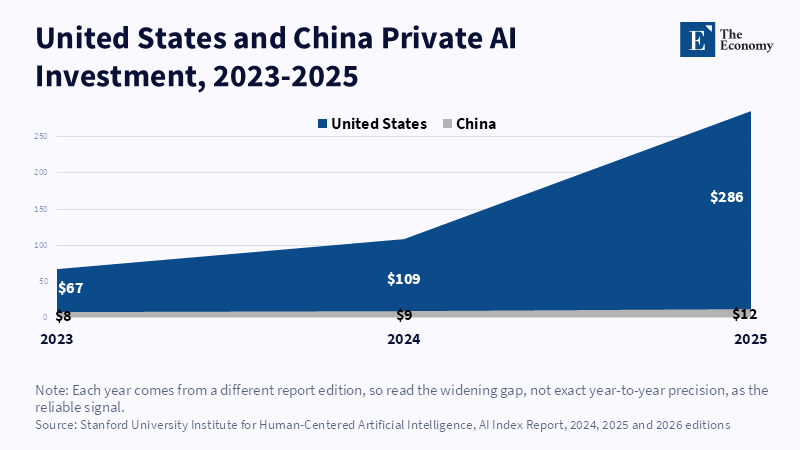
Figure 1. The US lead in private AI investment highlights the financial scale confronting middle powers.
Read More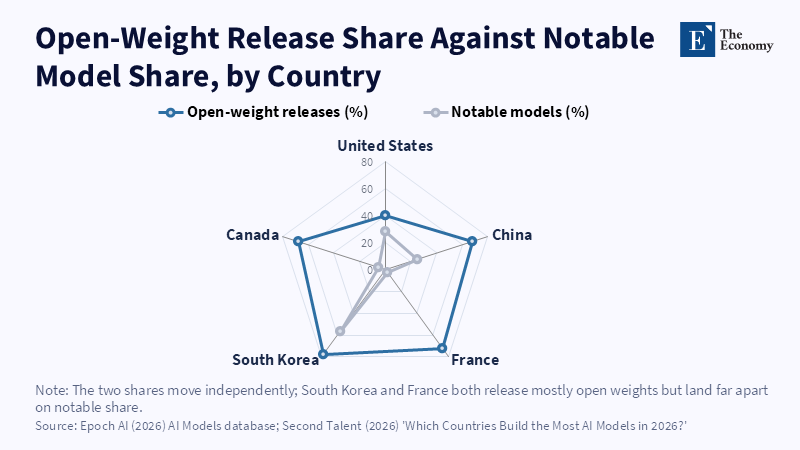
Related article: Middle Powers and the Limits of Collective Agency in Artificial Intelligence
Read More
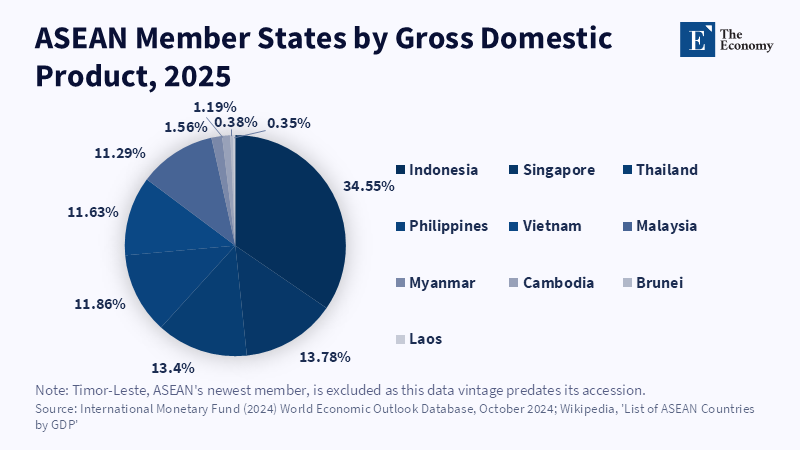
Figure 6. Indonesia’s large share highlights ASEAN’s unequal economic weights.
Read More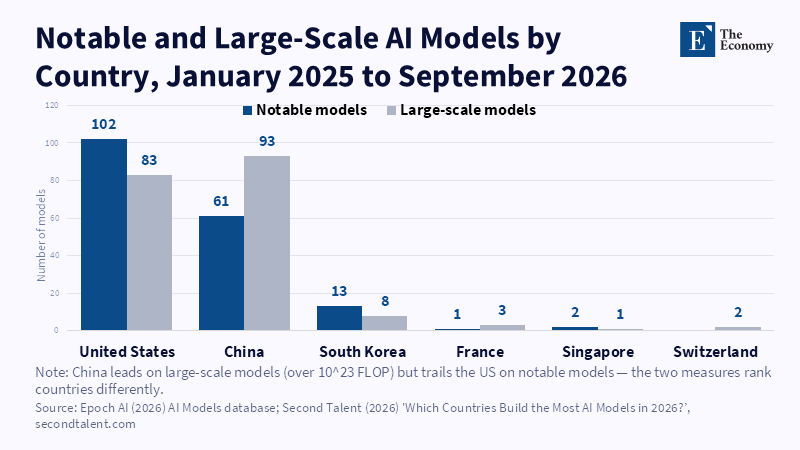
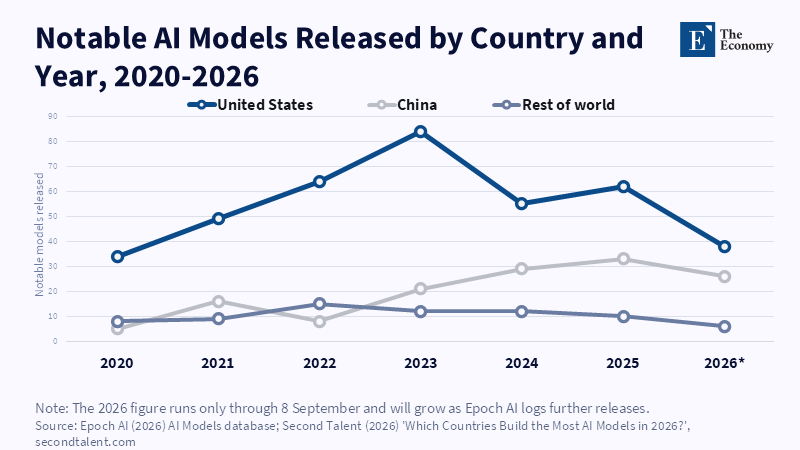
Figure 4. China’s notable model output expanded during 2023–2025, while the US remained ahead.
Read More
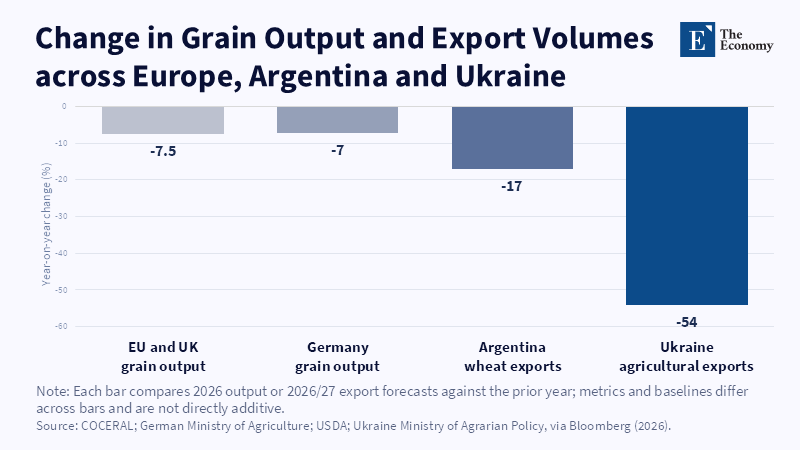
Figure 2: Three exporters' supply retreats at once, not one at a time. Related article: Grain Prices in E
Read More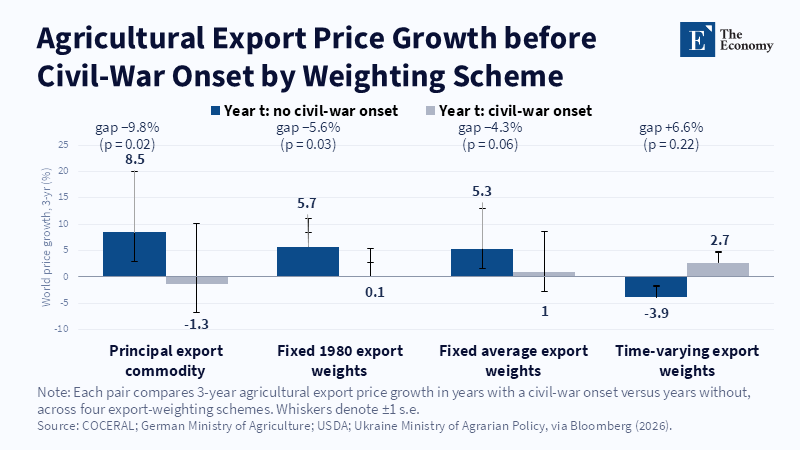
Figure 1: Prices tend to rise before peaceful years and stall or reverse before conflict. Related article: G
Read More
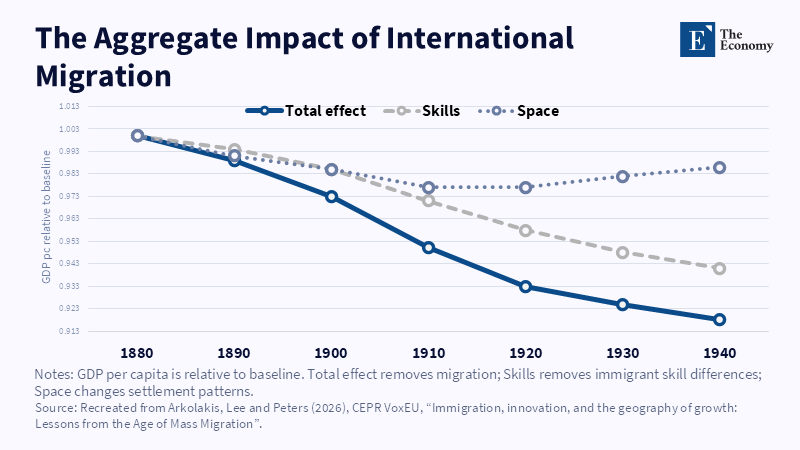
Figure 2: Skills account for most of the modeled GDP effect. Related article: Migration and Econom
Read More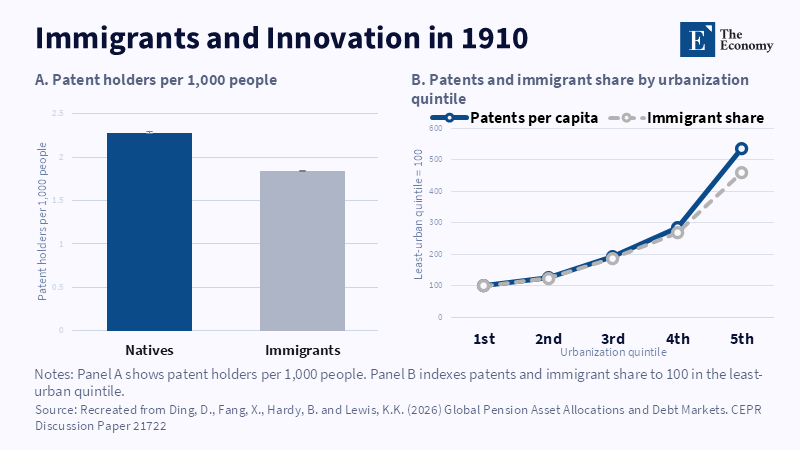
Figure 1: Patenting and immigrant concentration rose with urbanisation. Related article: Migration an
Read More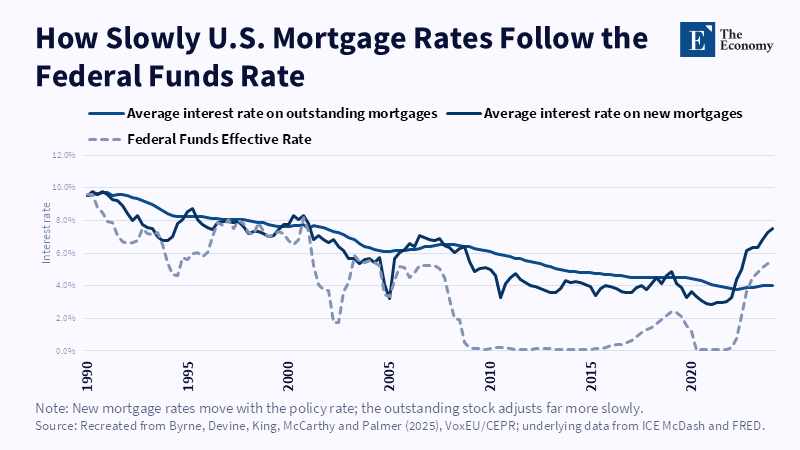
Figure 2: New mortgage rates track the federal funds rate closely; the outstanding stock adjusts far more slowly and with a lag of years. Related article:
Read More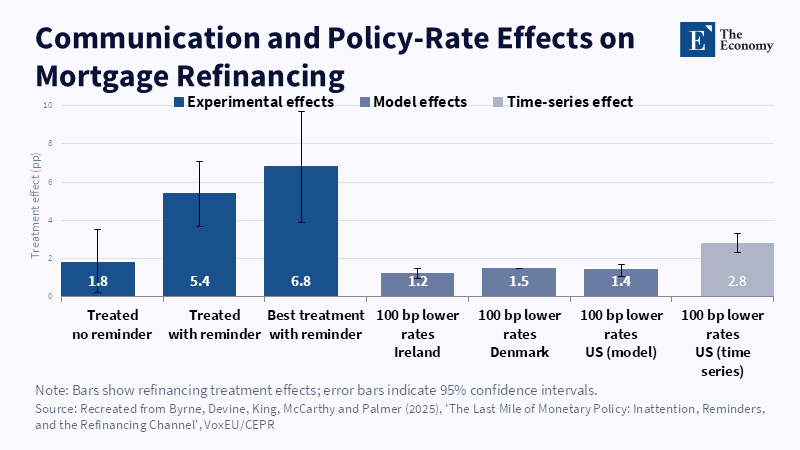
Figure 1: A reminder letter more than tripled the base treatment effect, rivalling the pull of a full percentage-point rate cut in comparable markets.
Read More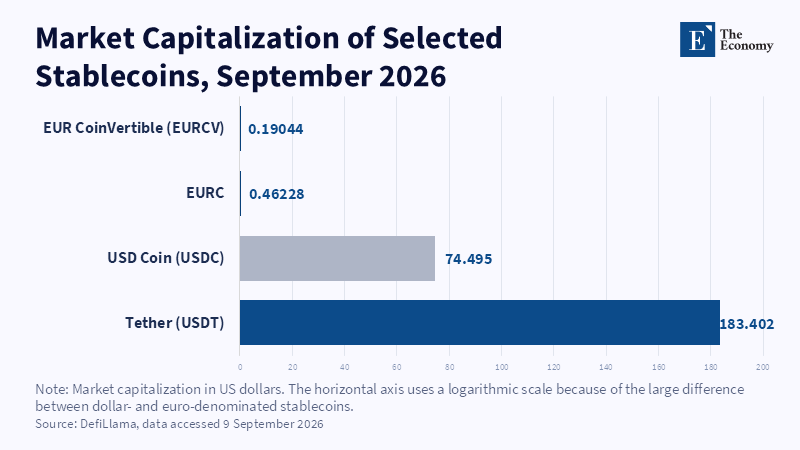
Figure 1: Even after MiCA's compliance boost, dollar-pegged stablecoins outweigh their euro counterparts by roughly 400 to 1. Related article:
Read More