
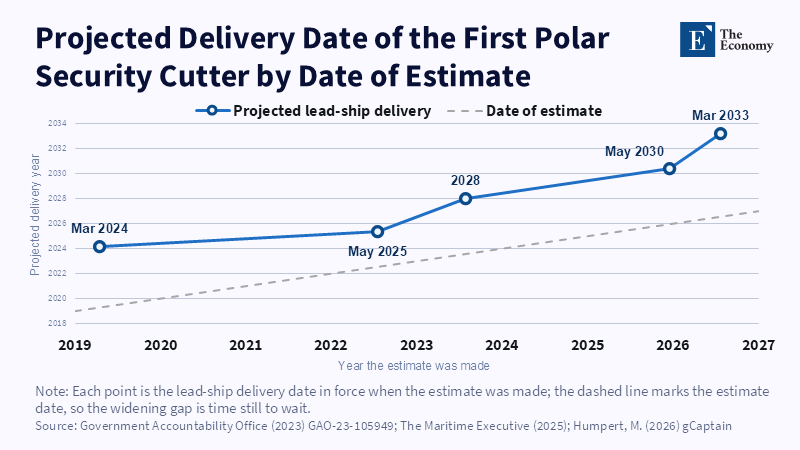
Figure: Each new estimate pushed delivery further out, so seven years after the contract the wait is longer than at the start. Related articles:
Read More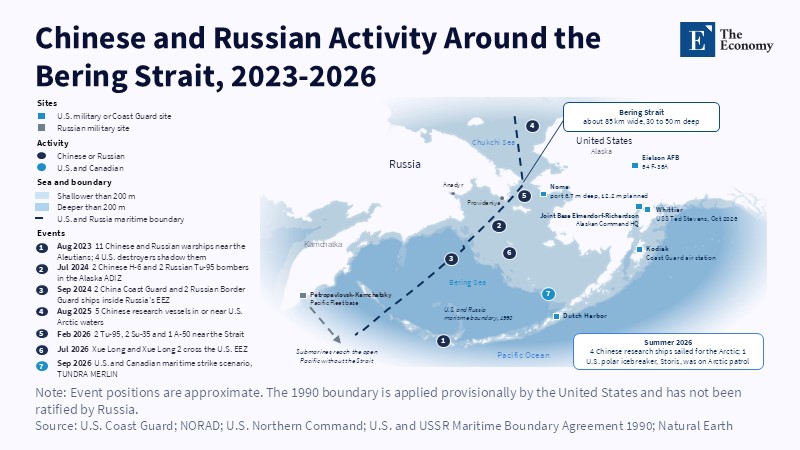
Figure: Most Chinese and Russian activity stays near the 1990 boundary, while Russia’s Pacific submarines reach the ocean without using the Strait. Related articles:
Read More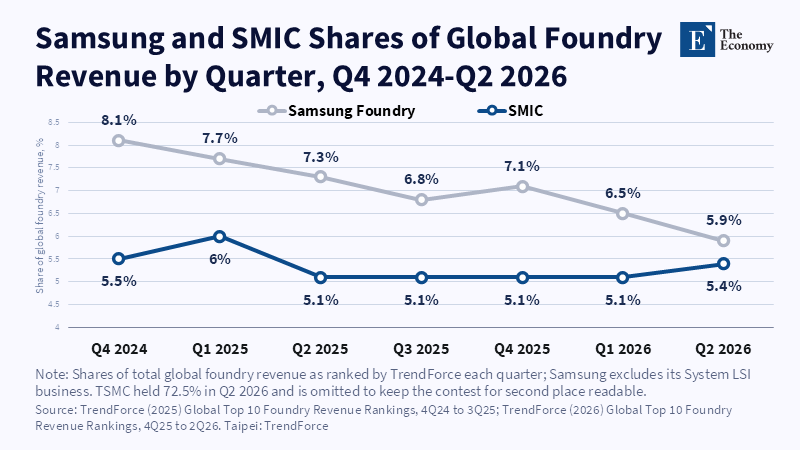
Figure: In six quarters, the gap between the second- and third-largest foundries shrank from 2.6 to 0.5 points. Related articles: Why the Sem
Read More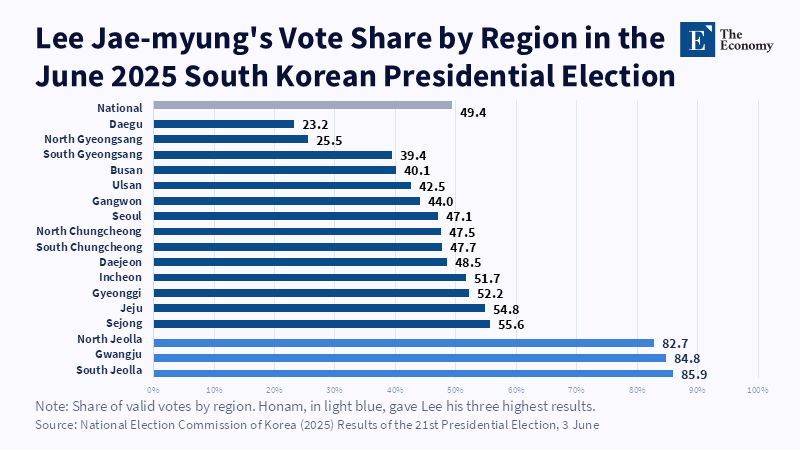
Figure: The 800 trillion won cluster is planned for the three regions that gave Lee his highest vote shares. Related articles: Why the Semic
Read More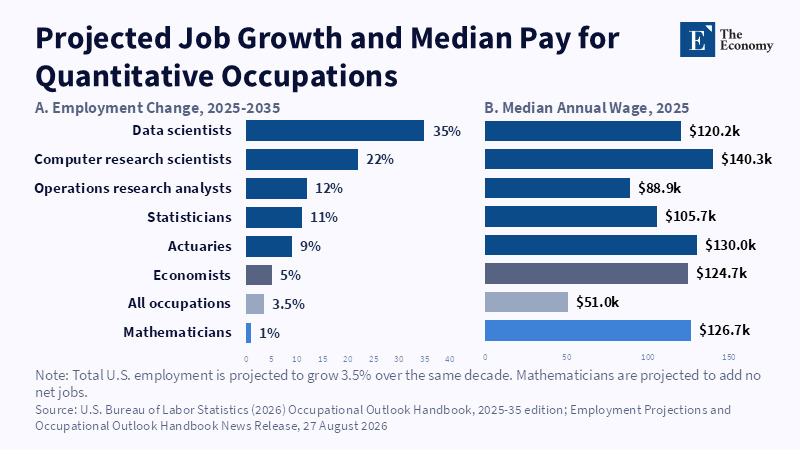
Figure: Mathematicians are among the best paid in the group, yet are the only occupation shown projected to add no jobs. Related articles:
Read More







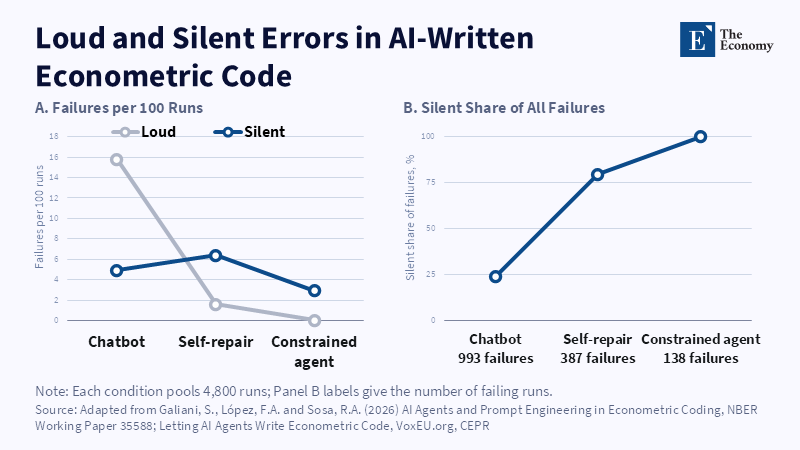
Figure: Autonomy removes the errors that announce themselves; every error that remains is silent. Related articles: AI and the Market
Read More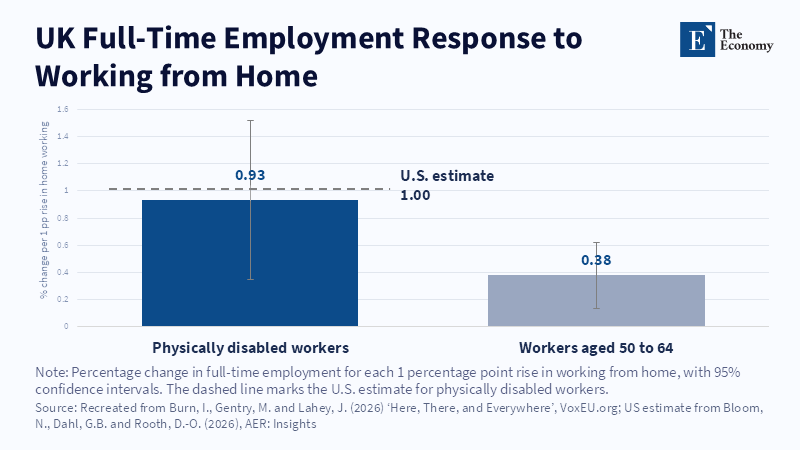
Figure: The UK estimate for disabled workers is close to the U.S.
Read More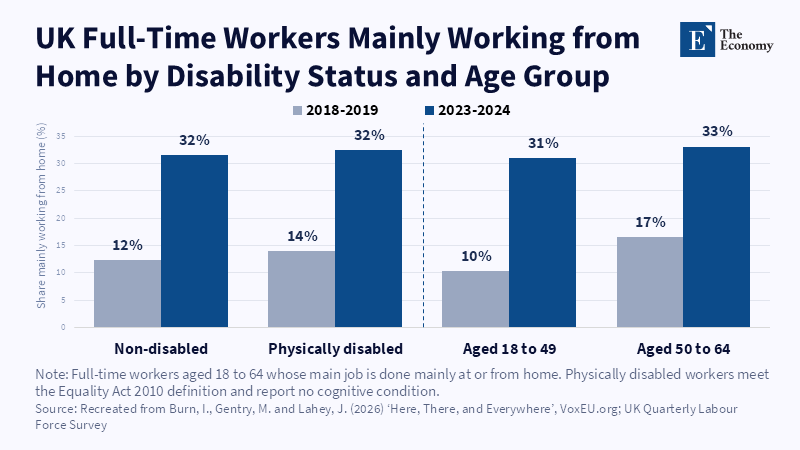
Figure: Home working nearly tripled in every group, so disabled workers gained the same access as everyone else. Related articles: Teleworking Bro
Read More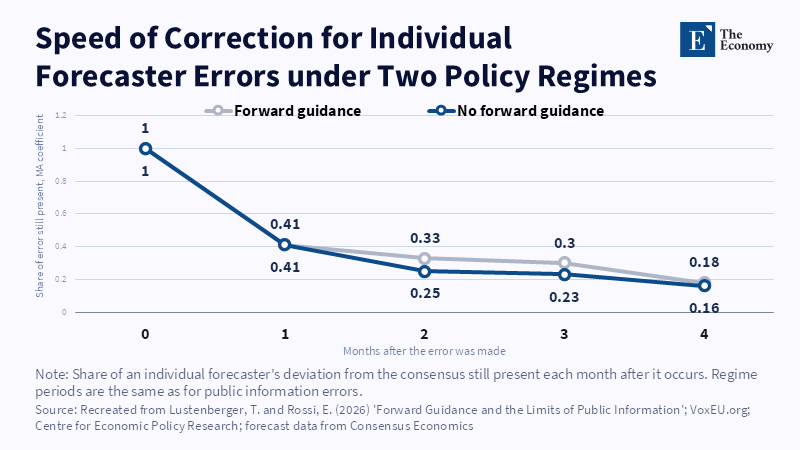
Figure: Individual forecasters corrected their own errors quickly under either regime. Related articles: Why Forward Guidance Fails in an Era of Shocks<
Read More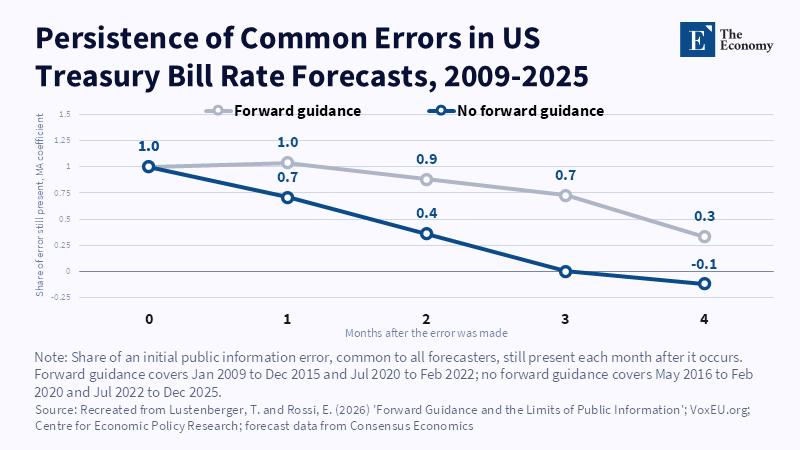
Figure: Under forward guidance, shared forecast errors were still at full size a month later. Related articles: Why Forward Guidance Fails in an Era of S
Read More
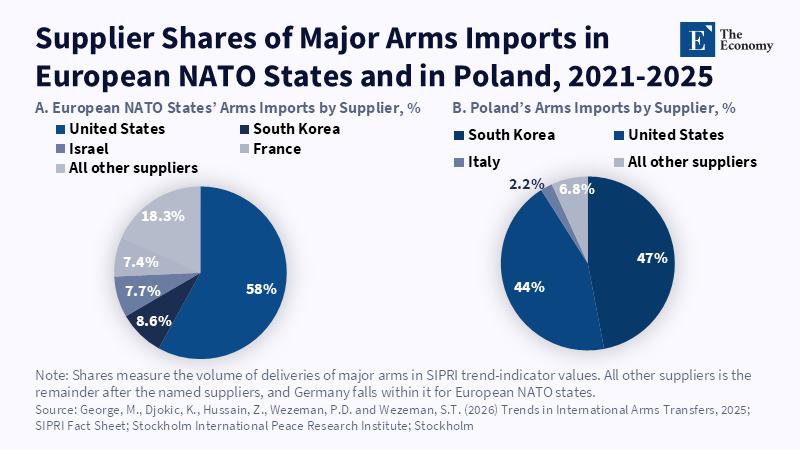
Figure: Poland, the bloc’s largest arms importer, now buys more from Seoul than from Washington. Related articles: How ‘Buy
Read More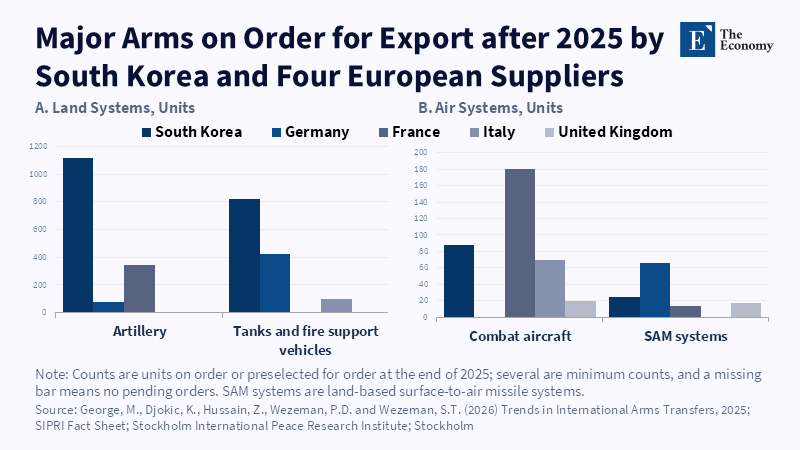
Figure: Korea’s land-systems order book exceeds four European suppliers combined, while Europe keeps the lead in the air. Related articles:
Read More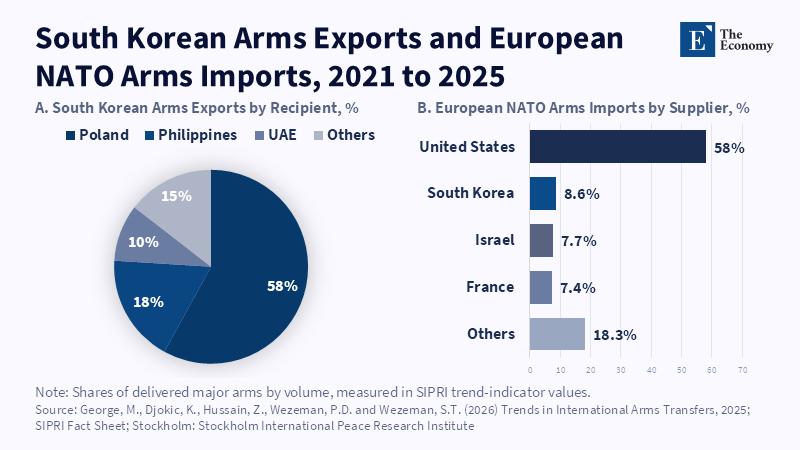
Figure: Korea’s 8.6% share of European NATO arms imports rests largely on one buyer, Poland, which takes 58% of all Korean arms exports. Related articles:
Read More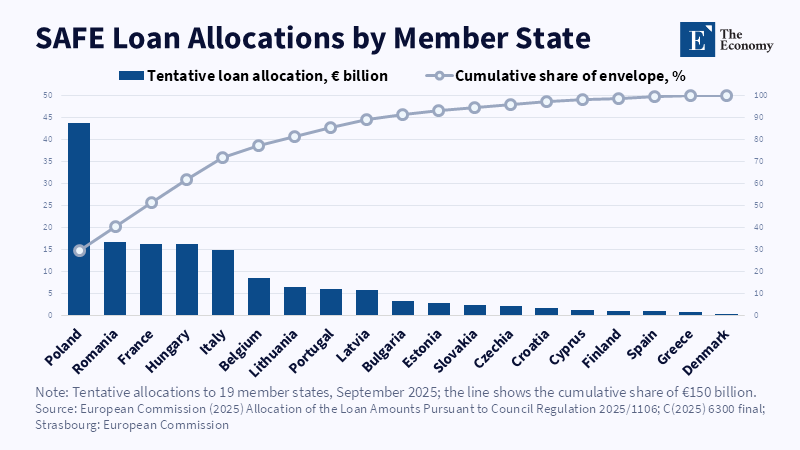
Figure: Poland alone holds 29.2% of SAFE loans, so the largest pool of EU defence credit sits with Korea’s biggest customer, not with Japan’s GCAP partners. Related articles:
Read More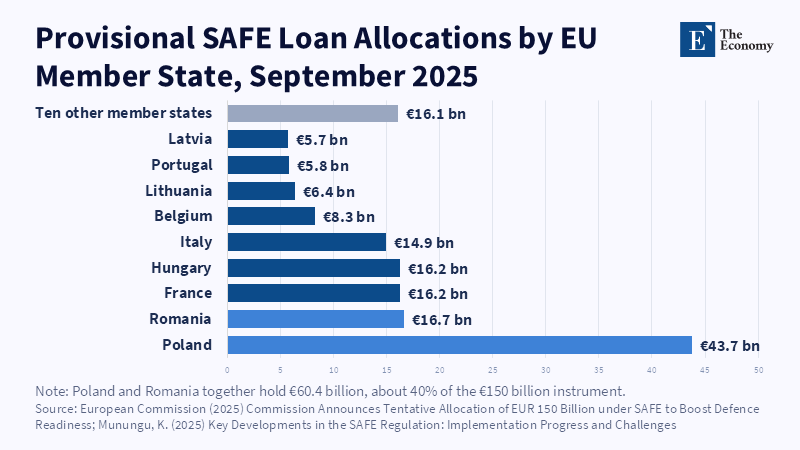
Figure: The two largest Korean customers in the EU also hold the two largest SAFE loans. Related articles: South Korean Defense Groups Shift
Read More
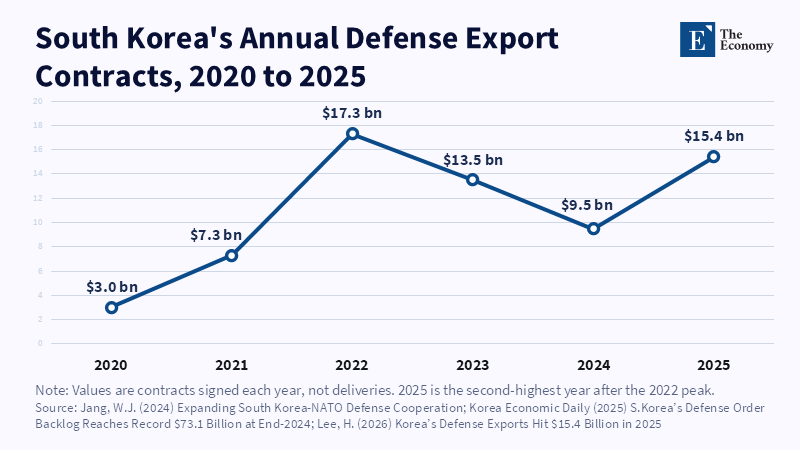
Figure: Korean orders swing sharply from year to year, and new European plants need steady ones. Related articles: South Korean Defense Grou
Read More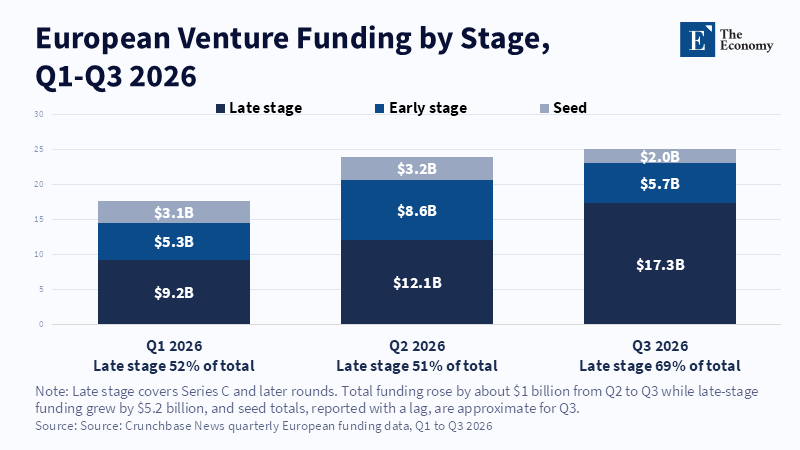
Figure: The total barely moved in Q3, while late-stage capital jumped to $17.3 billion, about 70% of funding. Related articles: Europe’s Tech
Read More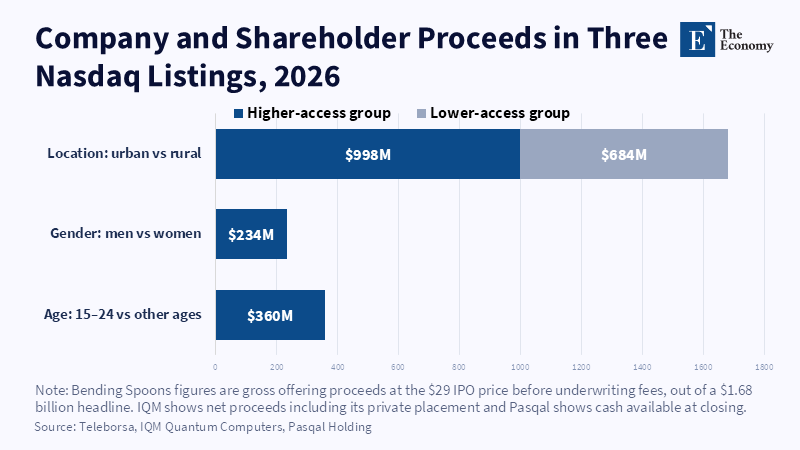
Figure: About $684 million of Bending Spoons’ $1.68 billion headline went to selling shareholders, not the company. Related articles: Europe
Read More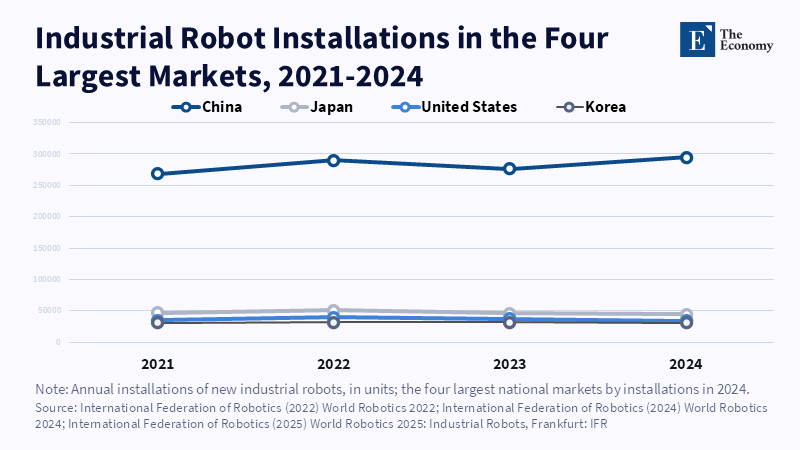
Figure: China installs more robots every year than Japan, the US and Korea combined. Related articles:
Read More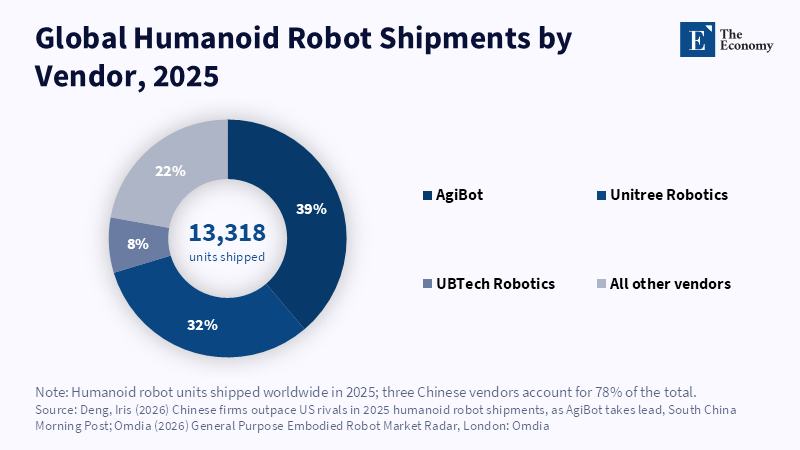
Figure: Three Chinese vendors shipped 78 percent of the world’s humanoid robots in 2025. Related articles:
Read More