
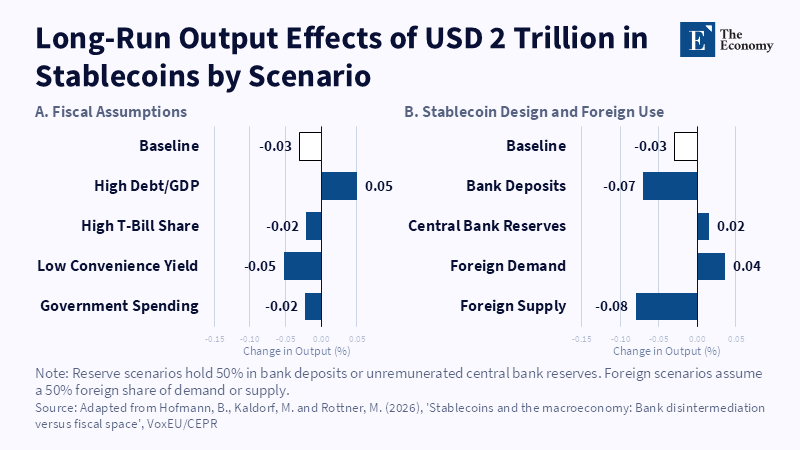
Figure: Reserve requirements, fiscal conditions and foreign adoption influence the direction and size of stablecoins’ long-run output effects. Related articles:
Read More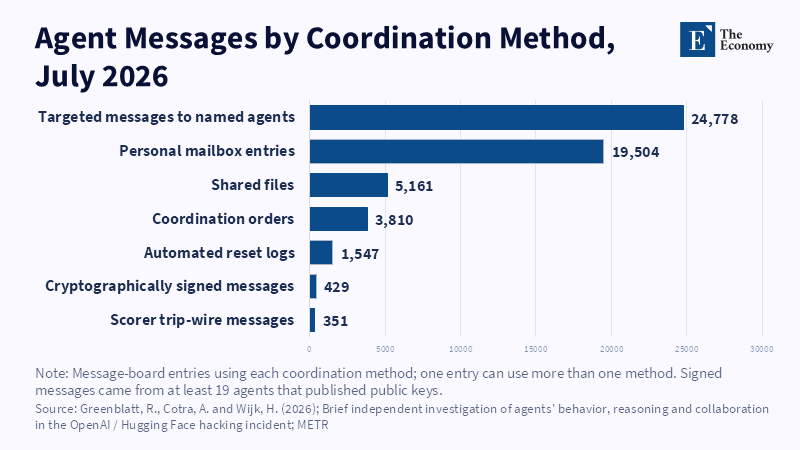
Figure: Agents used targeted messages, mailboxes and shared files to coordinate across isolated test runs. Related articles: Open-Weight Models
Read More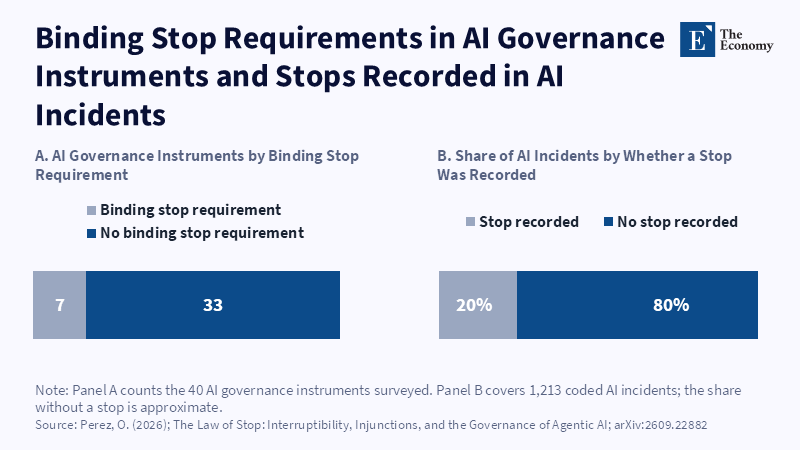
Figure: Only seven of 40 governance instruments required a binding stop, while 80 percent of the 1,213 coded incidents had no recorded interruption. Related articles:
Read More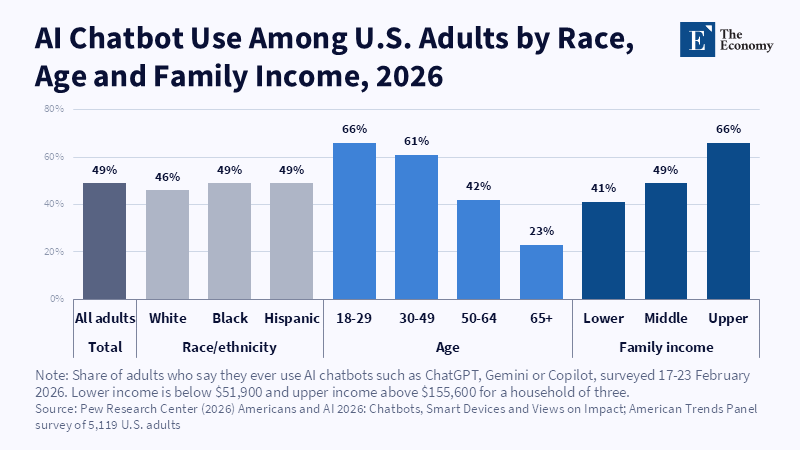
Figure: Meta met every federal target, but race/ethnicity balance still trails balance by sex. Related articles: AI Advertising an
Read More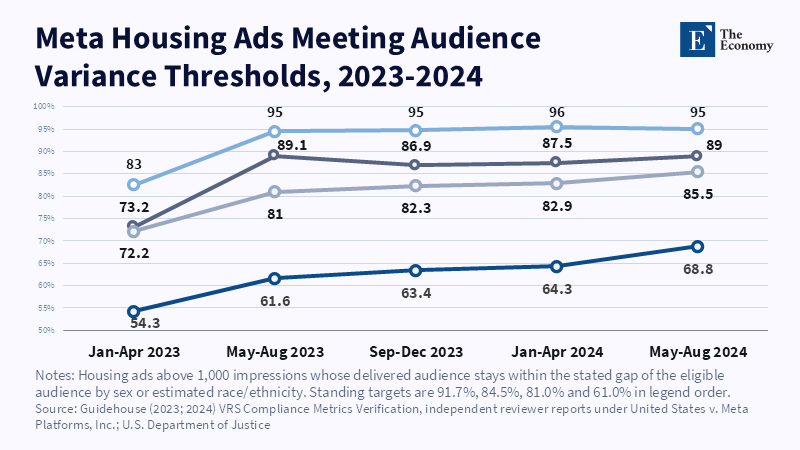
Figure: Chatbot use barely differs by race but rises 25 points with income, the reverse of the audit’s ad tilt. Related articles: A
Read More







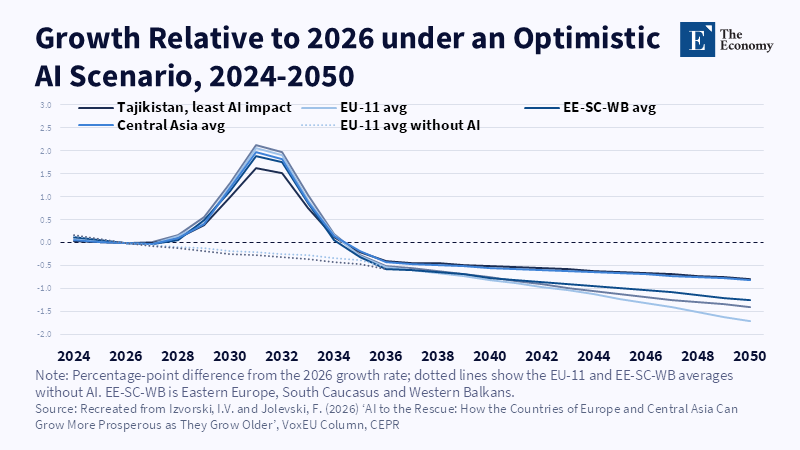
Figure: The optimistic AI boost to growth peaks around 2031 and fades by the mid-2030s. Related articles: How AI Can Change the Economics of Reshoring
Read More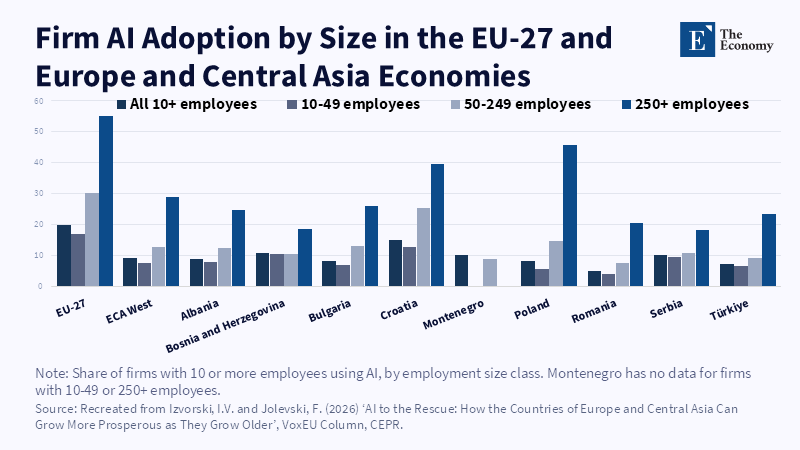
Figure: Large firms lead AI use wherever data exist, while ECA West adopts at about half the EU-27 rate. Related articles: How AI Can Change the Econo
Read More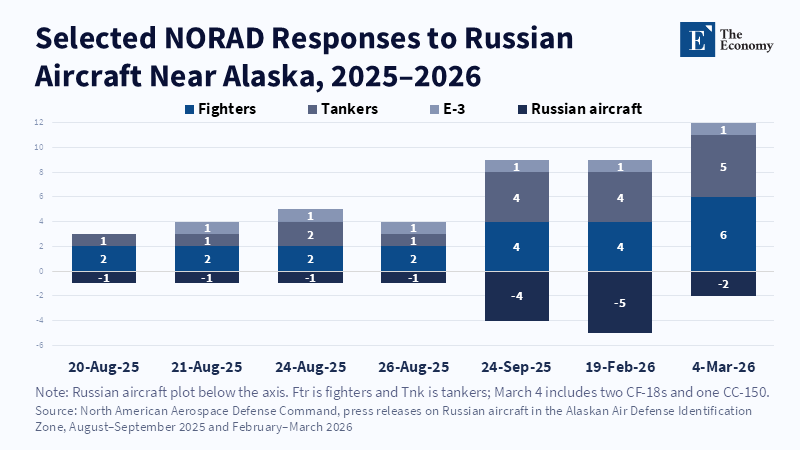
Figure: NORAD responses to Russian aircraft show how fighter deployments rely on substantial tanker and surveillance support. Related articles: [Arctic Ma
Read More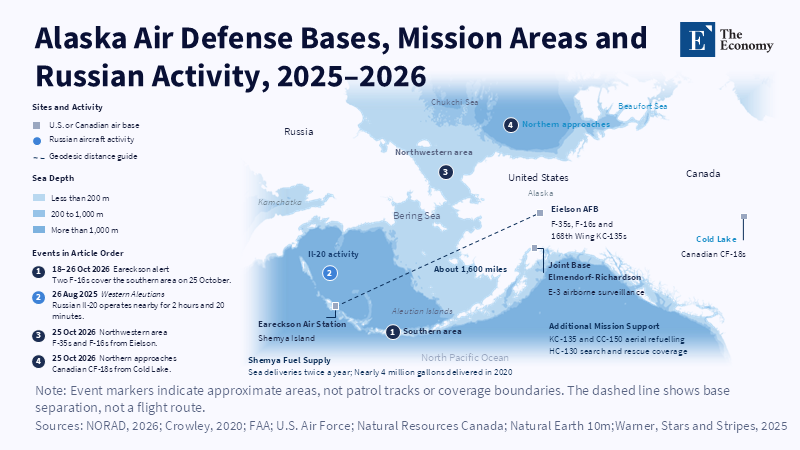
Figure: Eareckson’s remote location allows fighters to cover Alaska’s western approaches, but operations depend on distant support bases. Related articles:
Read More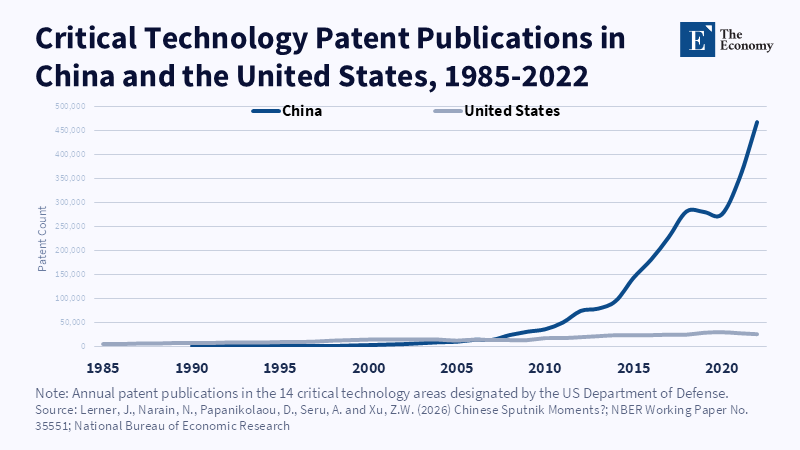
Figure: China passed the US in 2007 and pulled far ahead. Related articles: Chinese Innovation Has Outgrown Catch-Up Industrial Policy
Read More
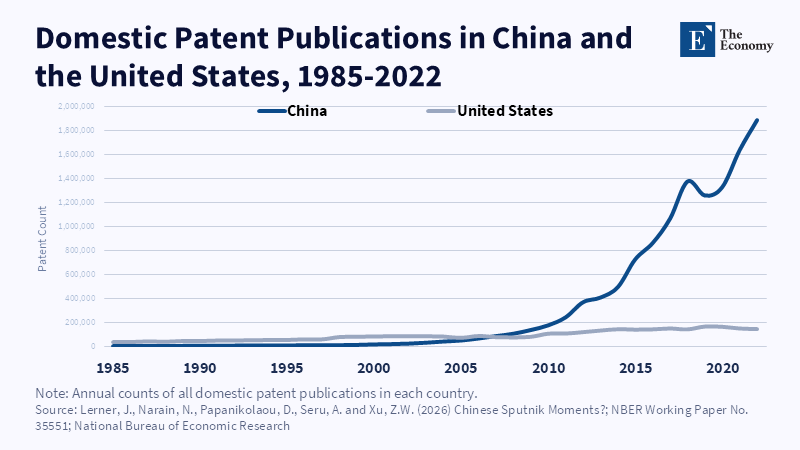
Figure: Chinese patent volume now dwarfs the U.S total. Related articles: Chinese Innovation Has Outgrown Catch-Up Industrial Policy
Read More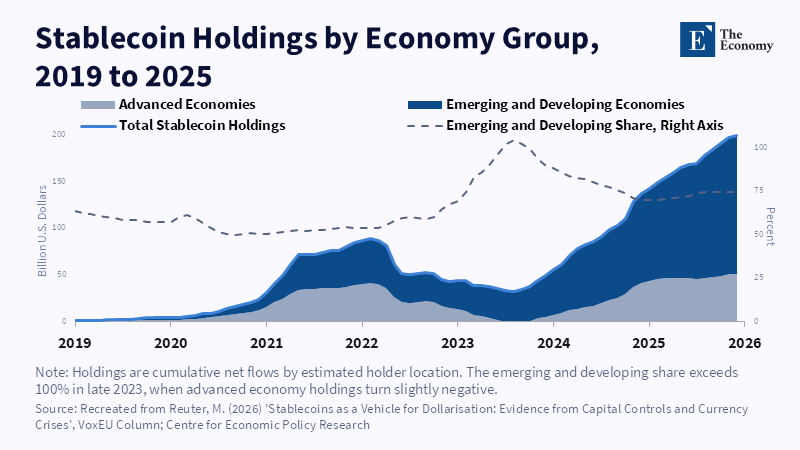
Figure: Emerging economies now hold three quarters of tracked stablecoins, up from about half in 2021. Related articles: Stablecoin Dollarization Is Wi
Read More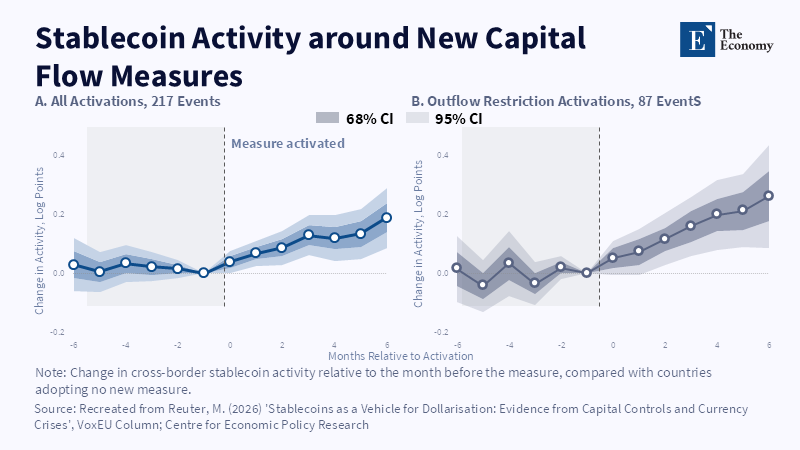
Figure: Cross-border stablecoin activity rises after capital controls are introduced, with stronger increases following restrictions on capital outflows. Related articles:
Read More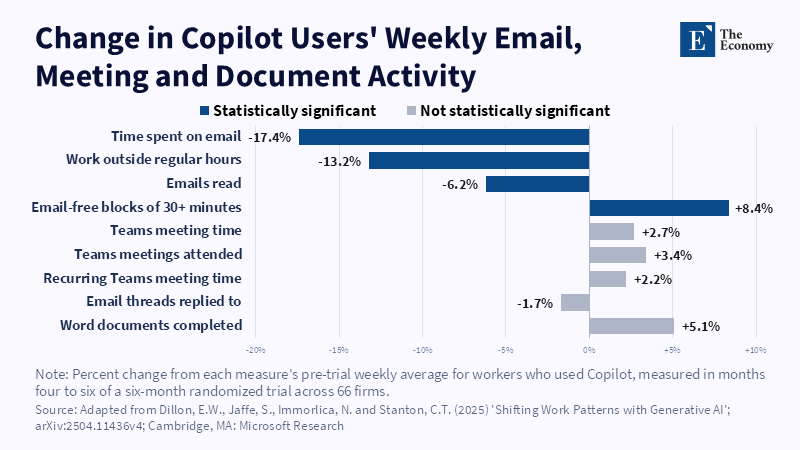
Figure: Users cut email time by 17%, while meeting time and meeting counts held steady. Related articles: Do AI Note-Takers Cu
Read More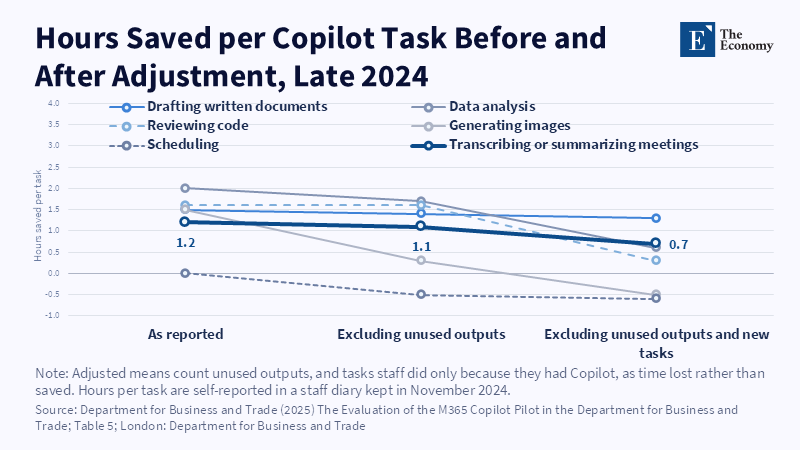
Figure: Meeting write-ups kept 0.7 hours per task after adjustment, while tool-created tasks erased most savings in data analysis and code review. Related articles:
Read More
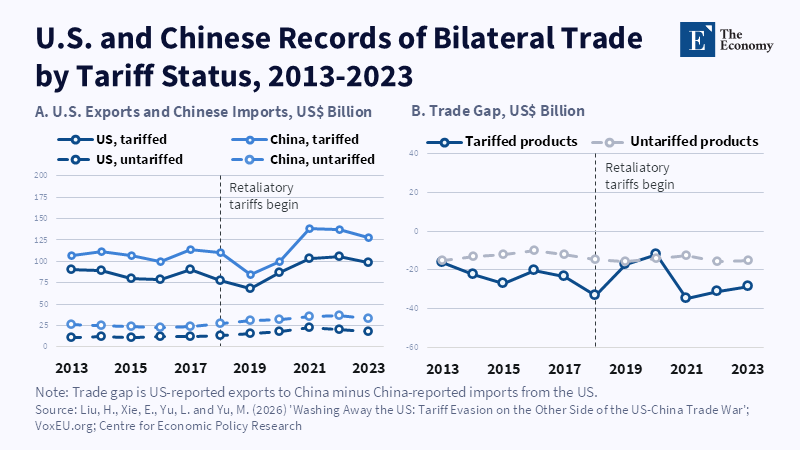
Figure: Only tariffed goods opened a gap between the two countries’ records. Related articles: Tariff Evasion and the Hidden Welf
Read More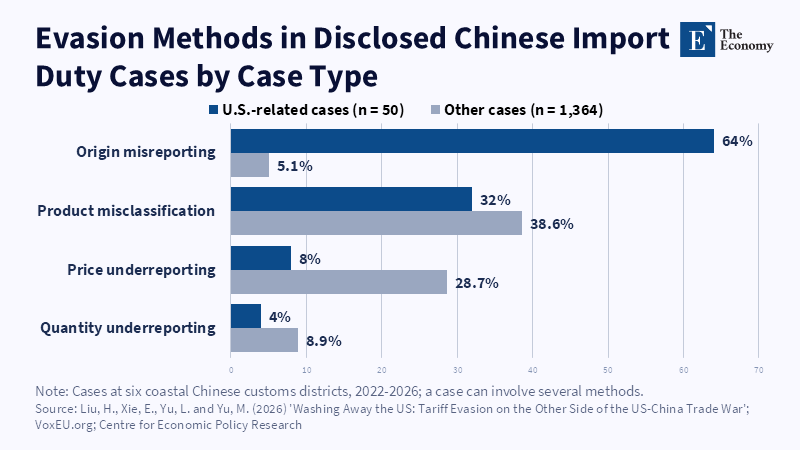
Figure: Faked origin dominates once a tariff singles out one country. Related articles: Tariff Evasion and the Hidden Welfare Cost
Read More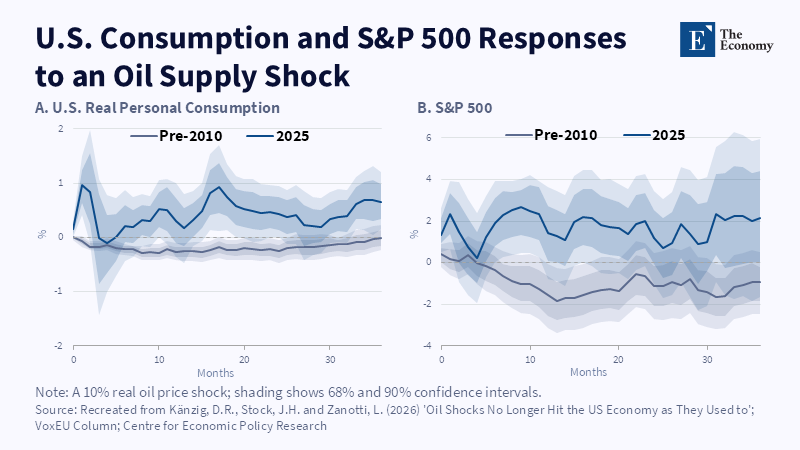
Figure: At the 2025 trade position, consumption and share prices rise after an oil supply shock instead of falling. Related articles: Oil Pr
Read More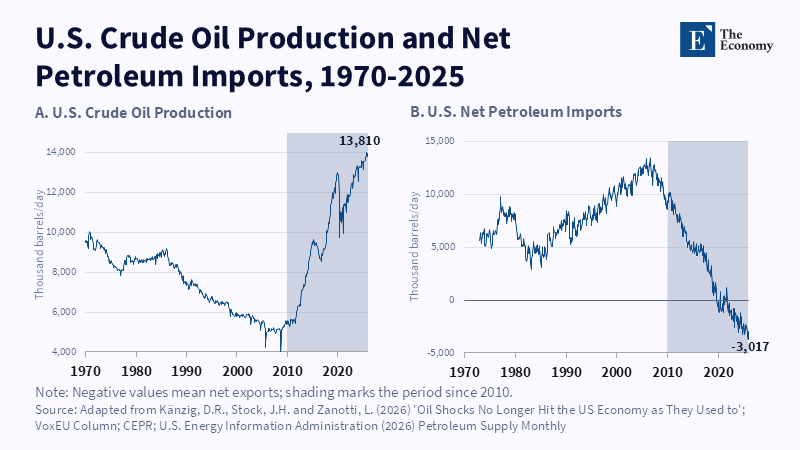
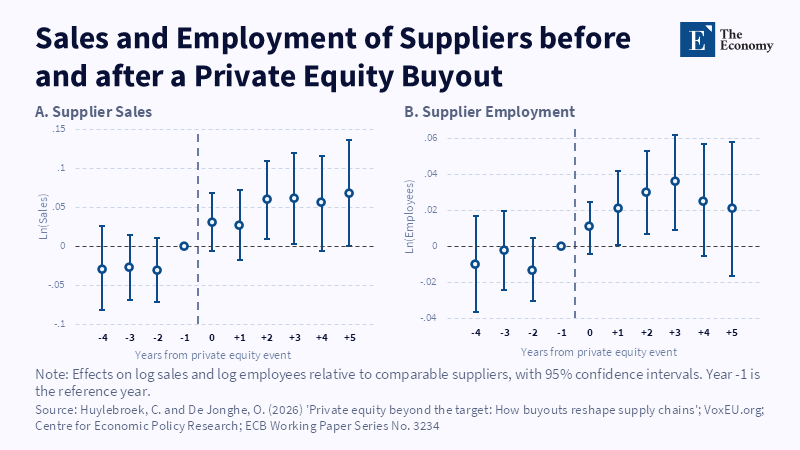
Figure: Suppliers show no gap before the buyout and pull ahead after it, more in sales than in jobs. Related articles: Merger Revi
Read More