
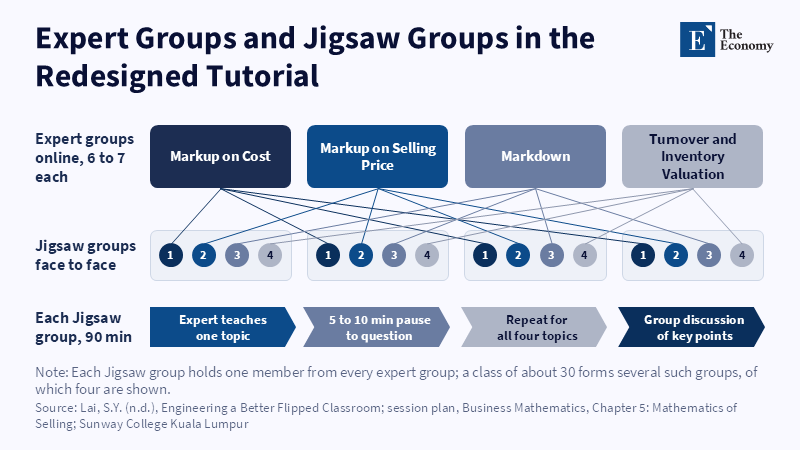
Figure: Each student arrives as the only expert on one topic, so no group can finish without hearing from every member. Related articles: Re
Read More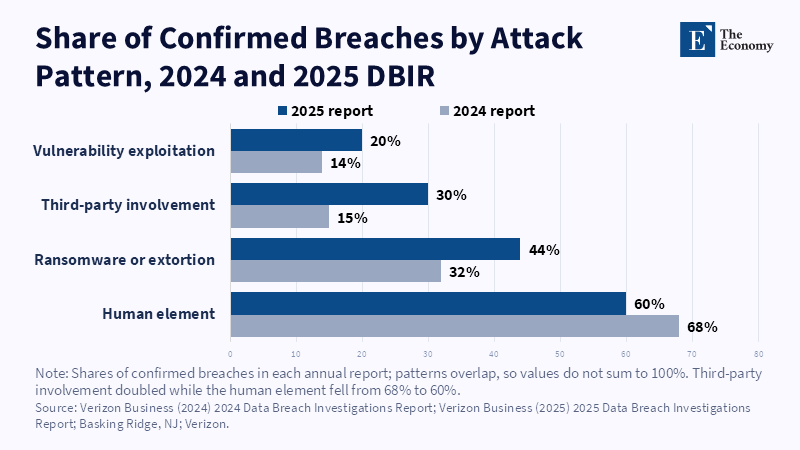
Figure: Third-party breaches doubled in a year as the human-element share slipped. Related articles: [Howie Chang Series] Is AI in Cybersecurity a
Read More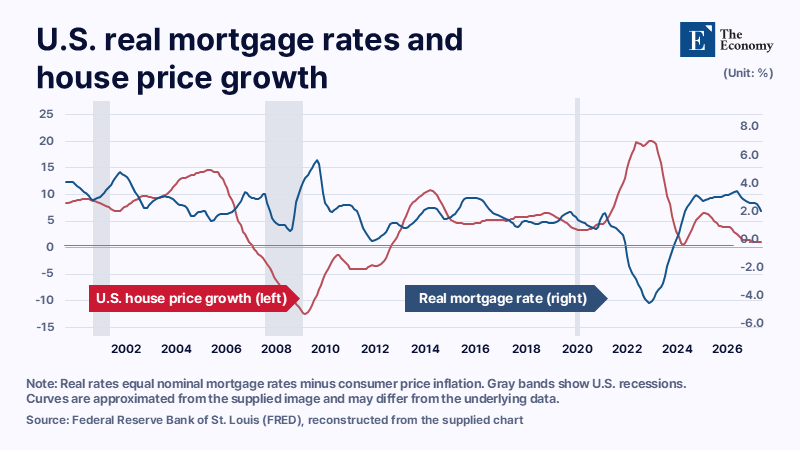
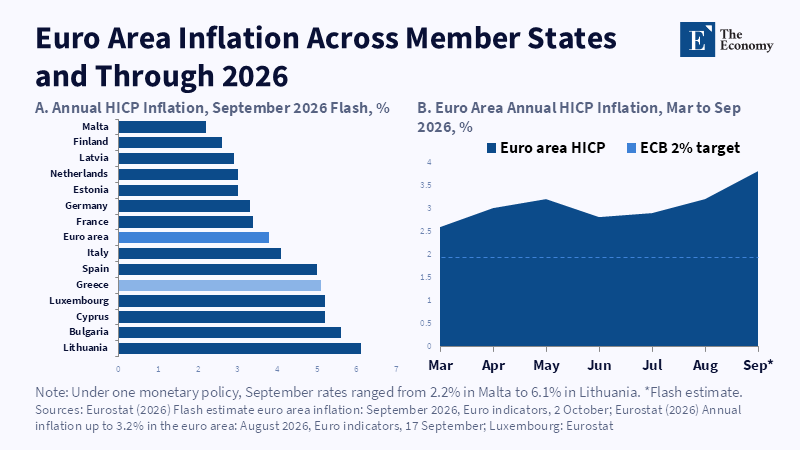
Related article: Geopolitical Shocks and Inflation: The Magnitude of the Crisis Determines the Price Path
Read More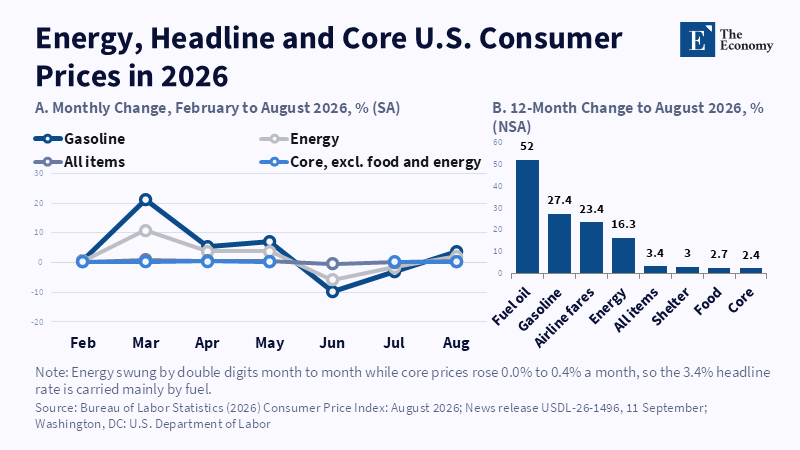
Figure 1: Gasoline jumped 21.2% in March alone while core prices never rose more than 0.4% a month. Related article:
Read More







Related articles: U.S.
Read More
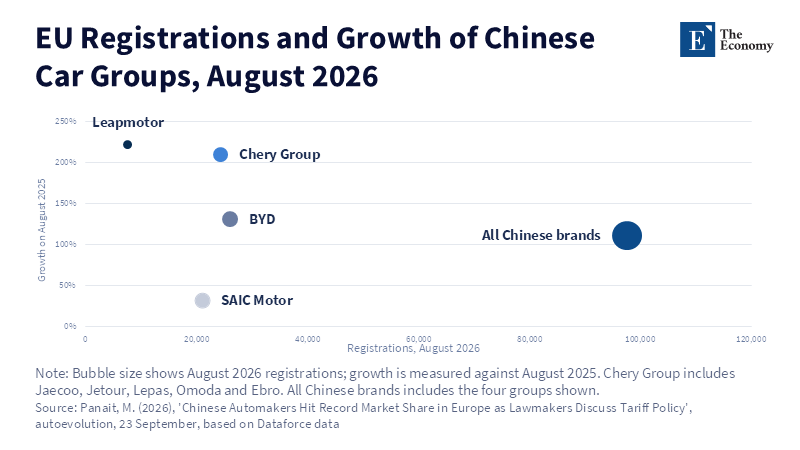
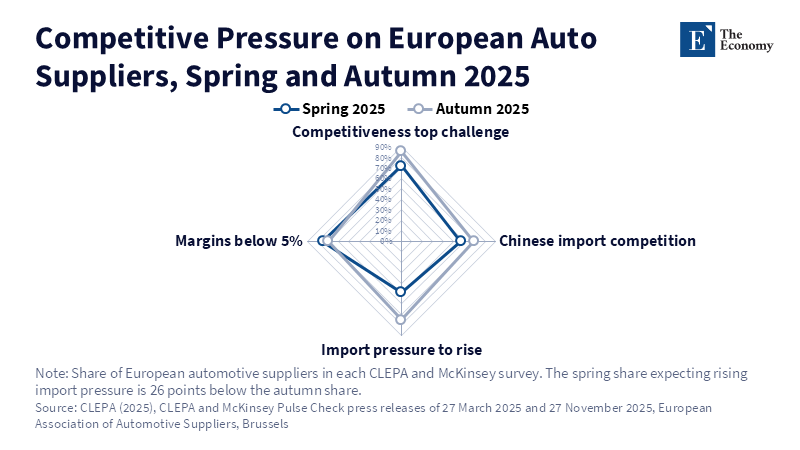
Related article: European Car Industry: The Case for Temporary Protection
Read More
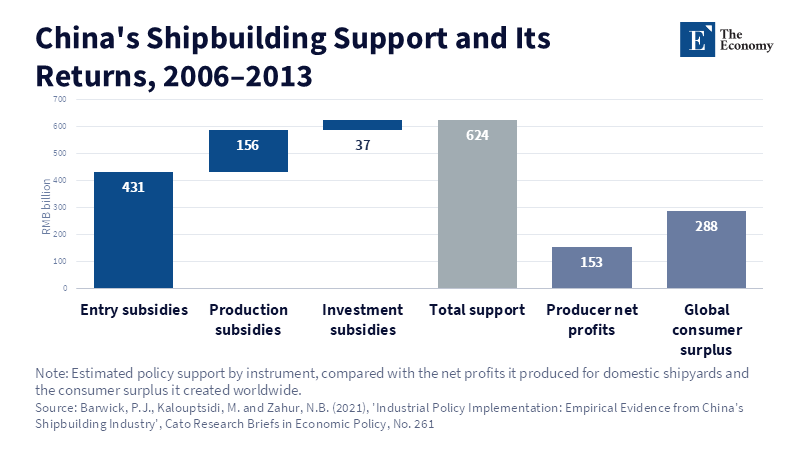
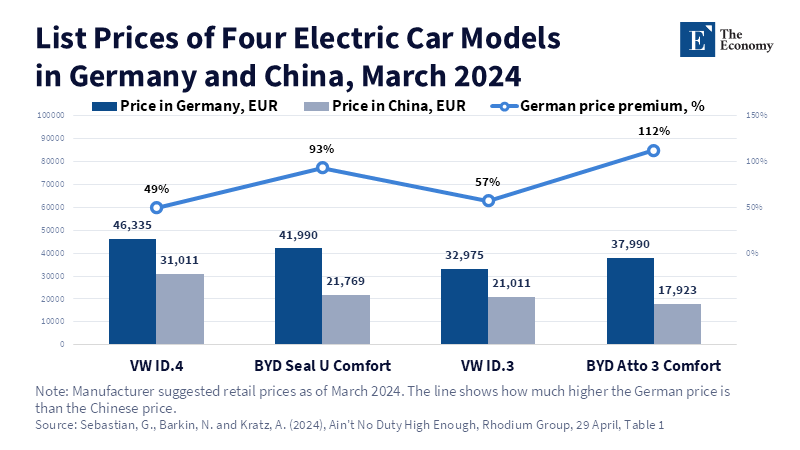
Figure 4. BYD's German prices ran 93% to 112% above its Chinese ones, nearly double Volkswagen's premium.
Read More
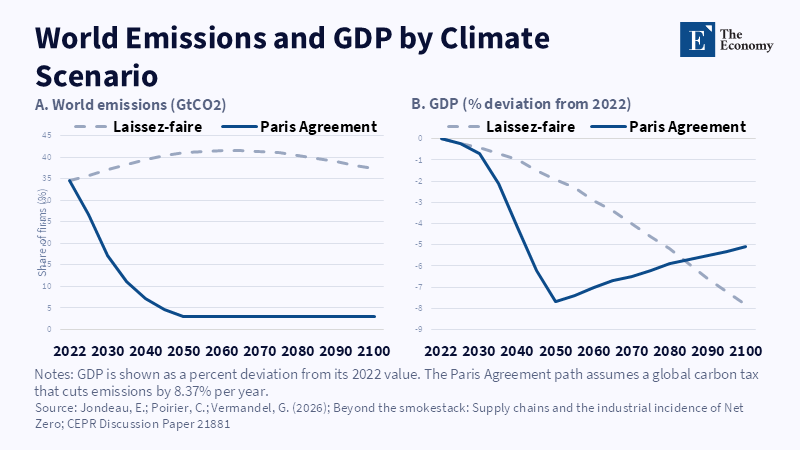
Figure 1: Emissions fall to 3 GtCO2 by 2050 under Paris, at an early GDP cost Related article: Carbon Tax
Read More
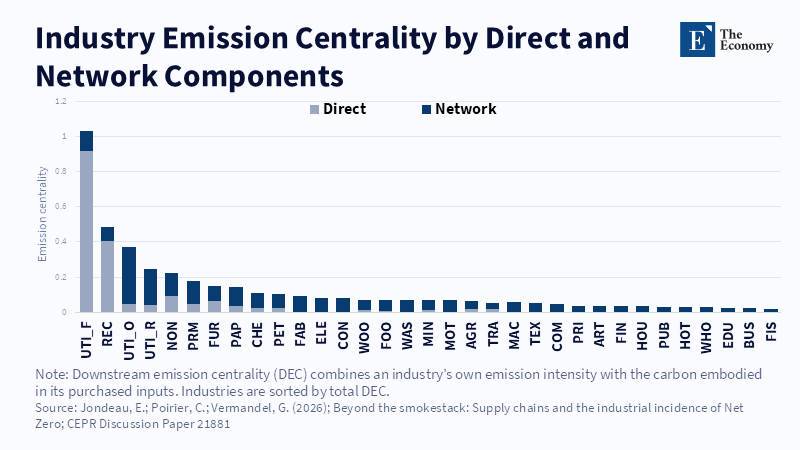
Figure 2: Network exposure outweighs direct emissions for most industries Related article: Carbon Tax an
Read More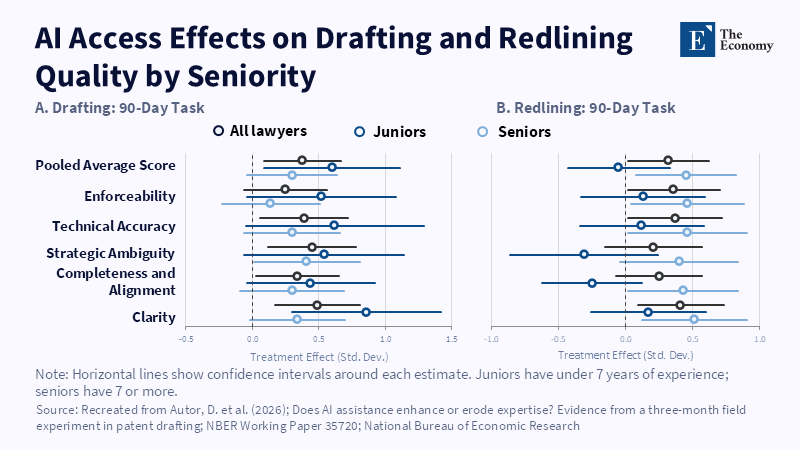
Figure 1: AI lifted junior drafts most, yet only seniors kept the gain without it. Related article: AI Tr
Read More
Figure 2: Treated juniors split toward both very low and good scores; treated seniors shifted upward. Related article:
Read More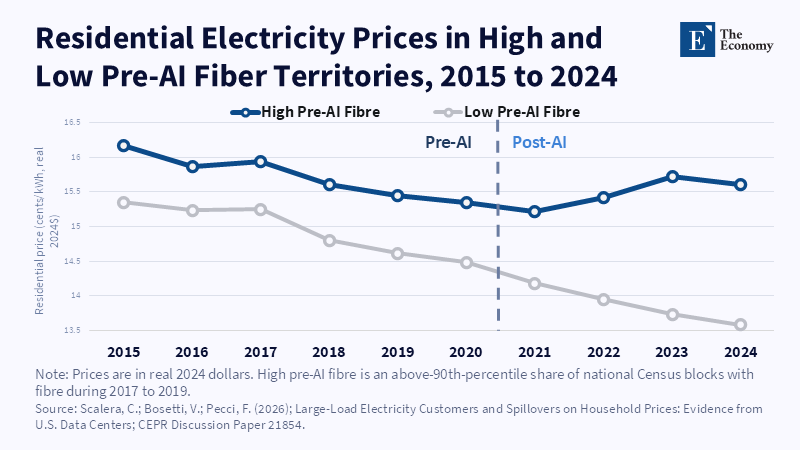
Figure 1: Openings jump from 137 to 212 in 2021, while spending accelerates only from 2023.
Read More
Figure 2: After 2021, high-fiber prices rebound to about 15.6 cents while low-fiber prices keep falling. Related article:
Read More