
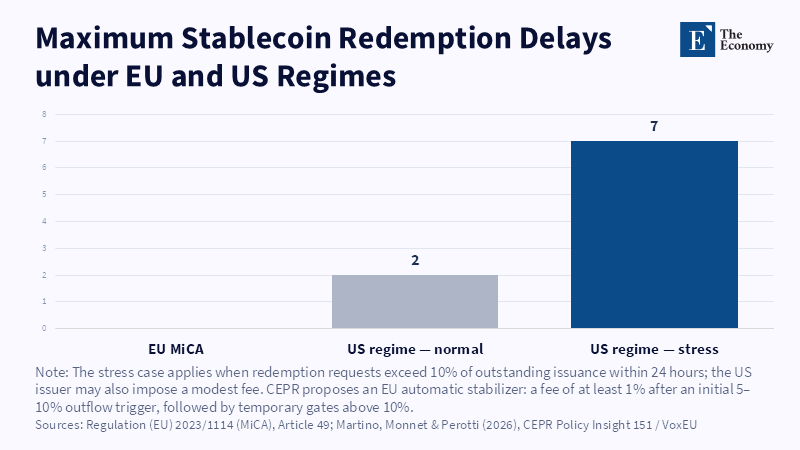
Figure 2: MiCA's redemption promise leaves the EU issuer as the only fixed point when outflows accelerate. Related article:
Read More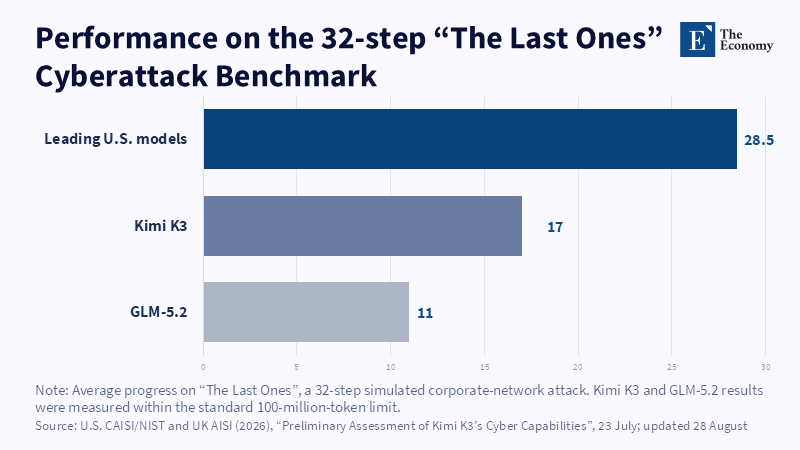
Figure 1: On a 32-step simulated attack, Kimi K3 completed barely six of every ten steps the leading US models did. Related article:
Read More
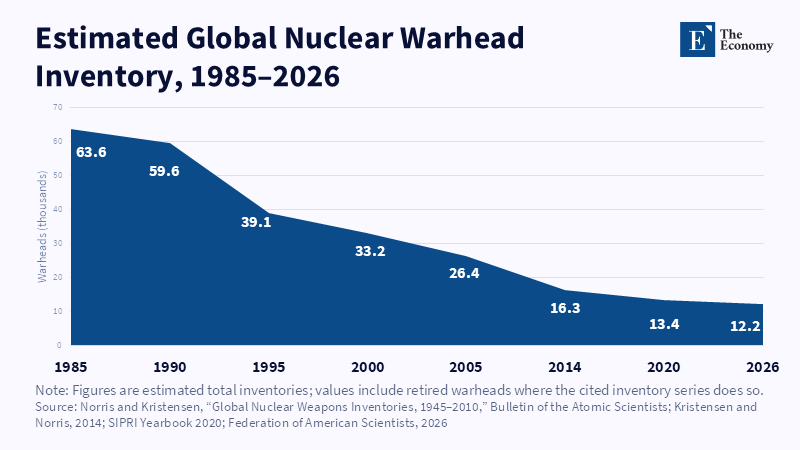








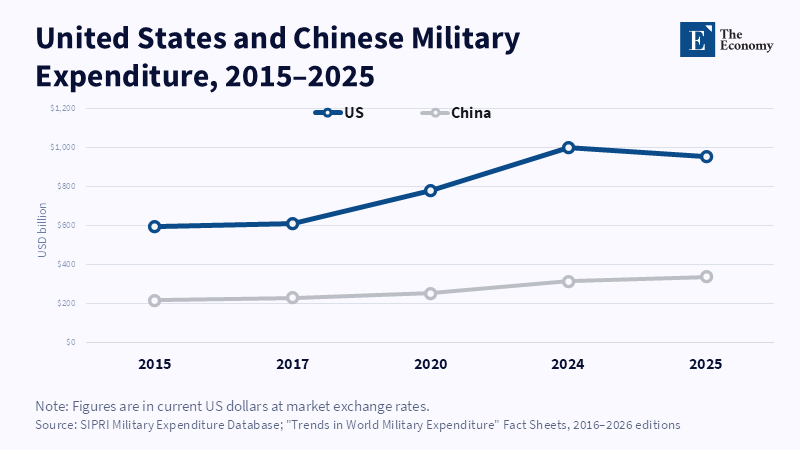
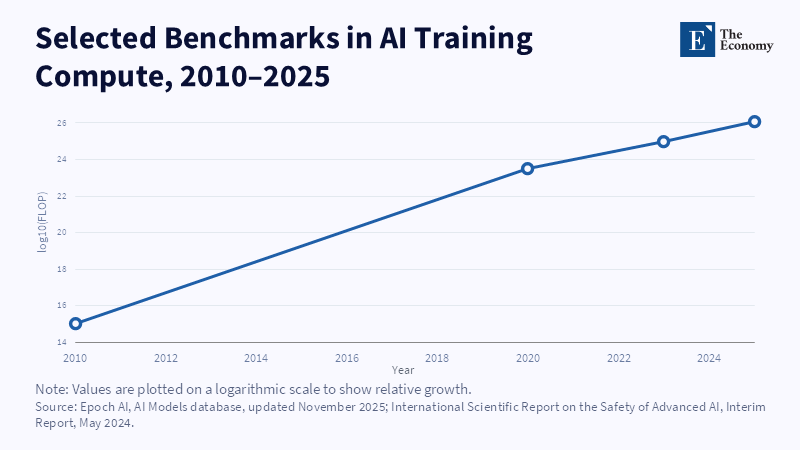
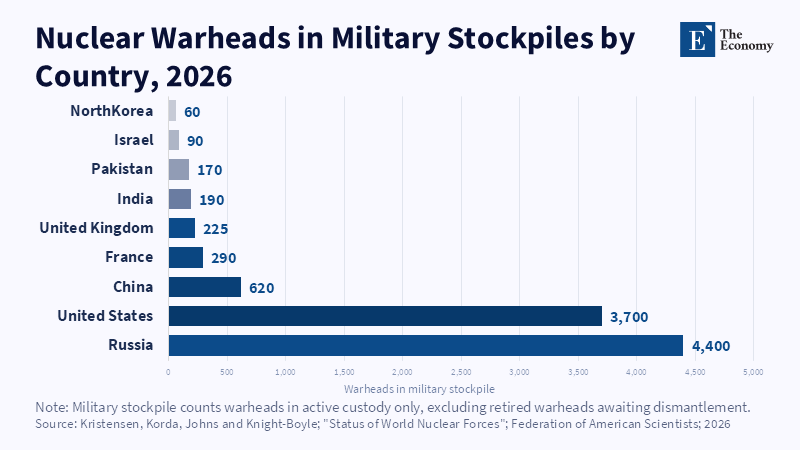
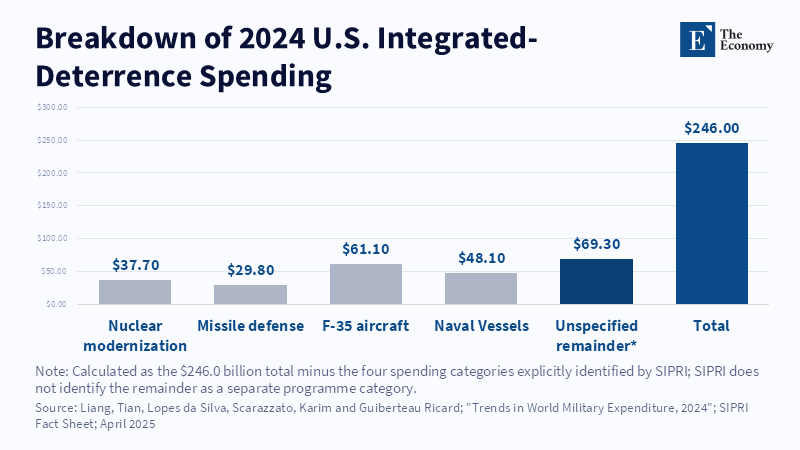
Figure 3. Less than a sixth of this budget funds nuclear modernization itself; the rest buys aircraft, ships, and missile defense.
Read More
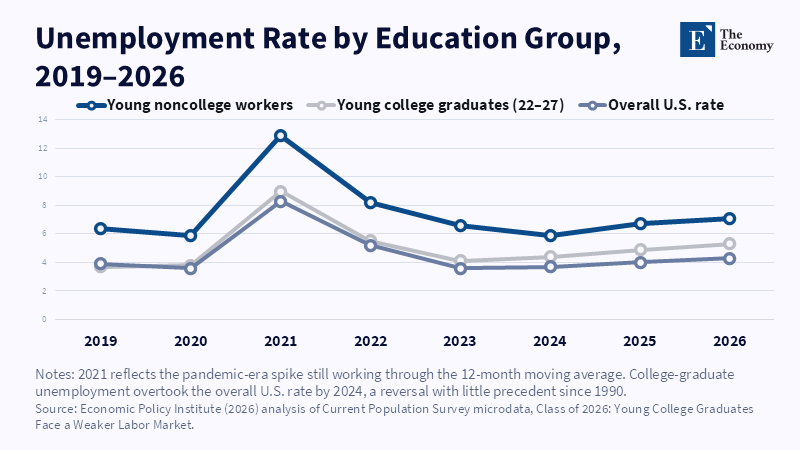
Figure: College graduates once carried a built-in employment advantage over their non-college peers.
Read More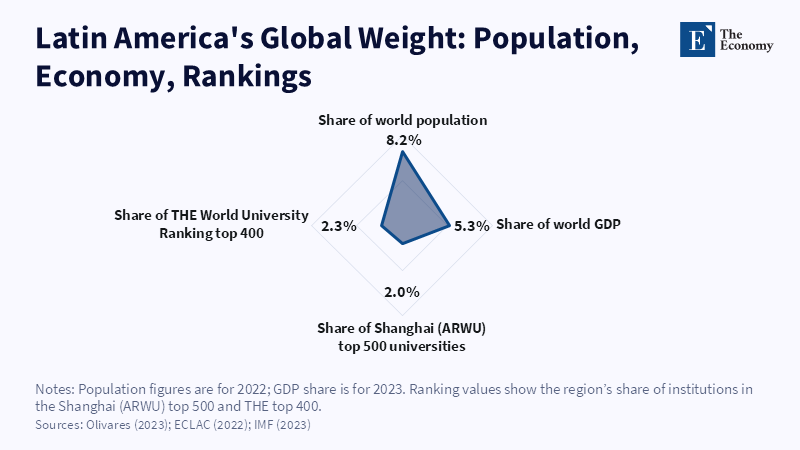
Figure: Latin America’s representation in global university rankings trails its demographic and economic weight. Related Articles: Quality Assurance Certifies
Read More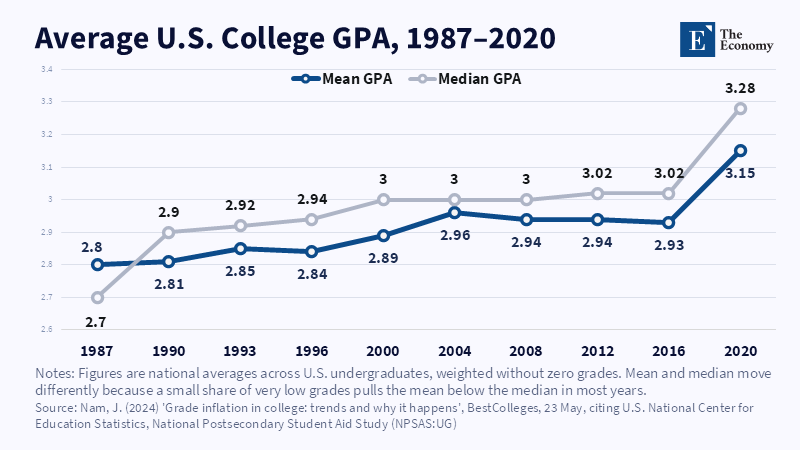
Figure: Rising U.S.
Read More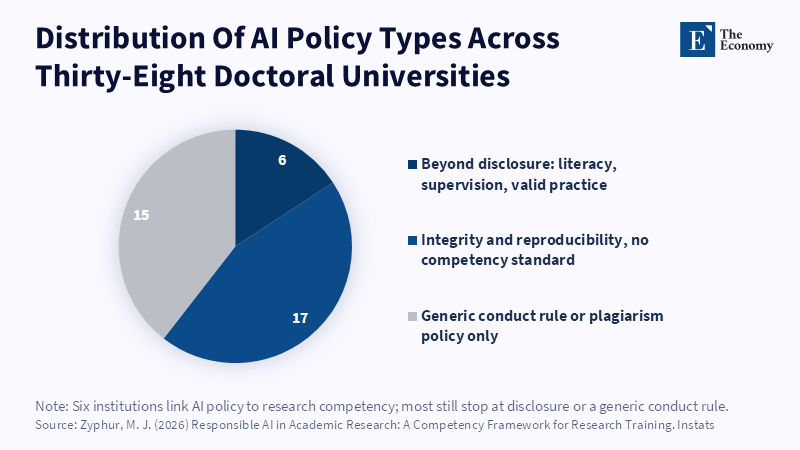
Figure: How Zyphur's 38-university sample splits across three policy types identified in his audit. Related Articles: Cognitive Internalization: The N
Read More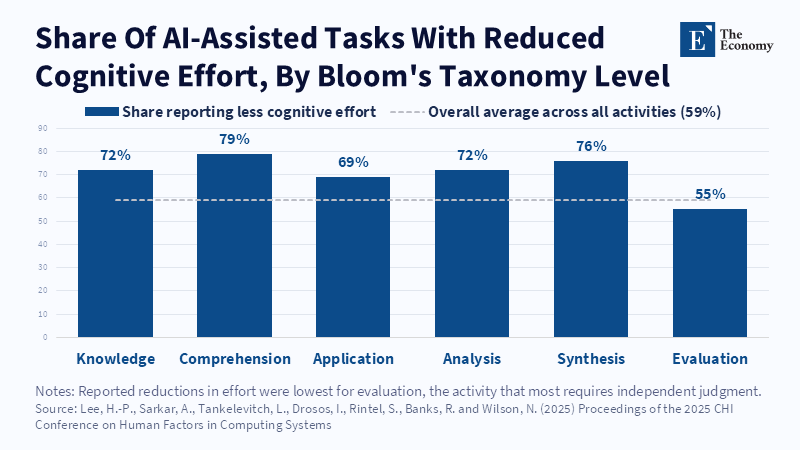
Figure: Reported reductions in effort were lowest for evaluation, the activity that most requires independent judgment. Related Articles: Cognitive Int
Read More
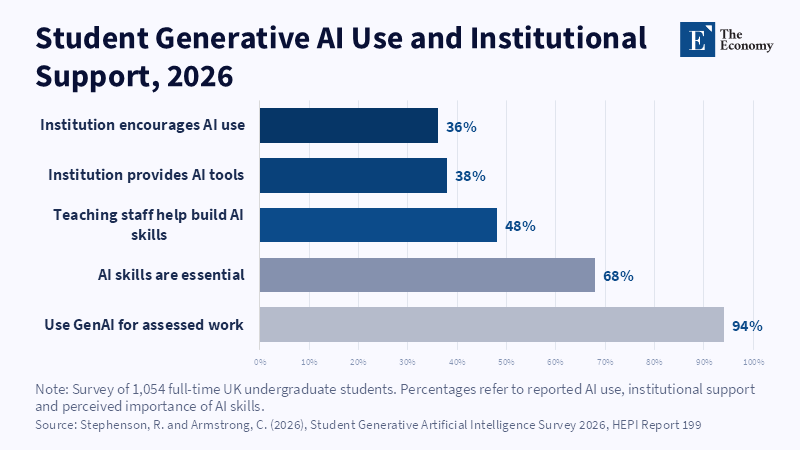
Figure: Student AI adoption far exceeds institutional support and guidance. Related Articles: Critical Thinking in Education: Assessment
Read More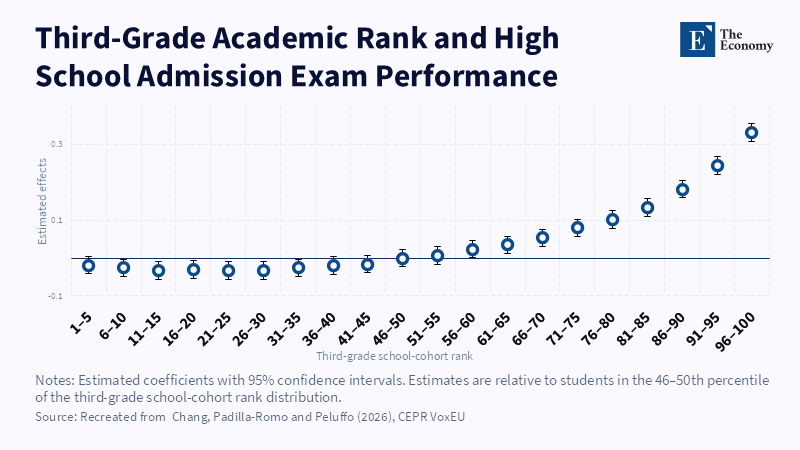
Figure: The effect of early academic rank rises sharply toward the top of the local rank distribution. Related Articles: Academic Ranking and Neighborhood
Read More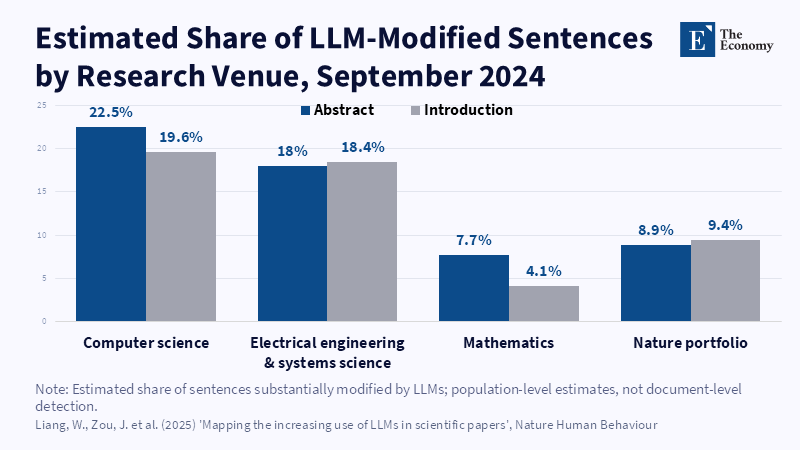
Figure: Computer science shows the sharpest jump in AI-modified writing of any field tracked. Related Articles: The Publication
Read More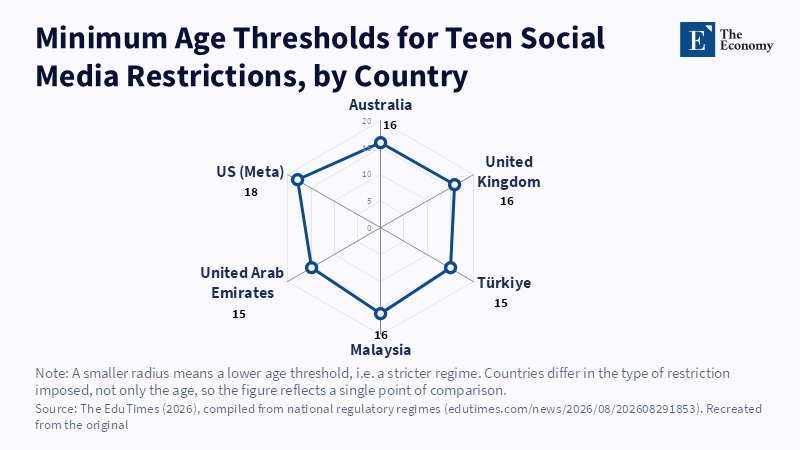
Figure: No two countries agree on the right minimum age or type of restriction. Related Articles: The Teens Who Will Bypass Meta's Two-Hour Limit | The Ec
Read More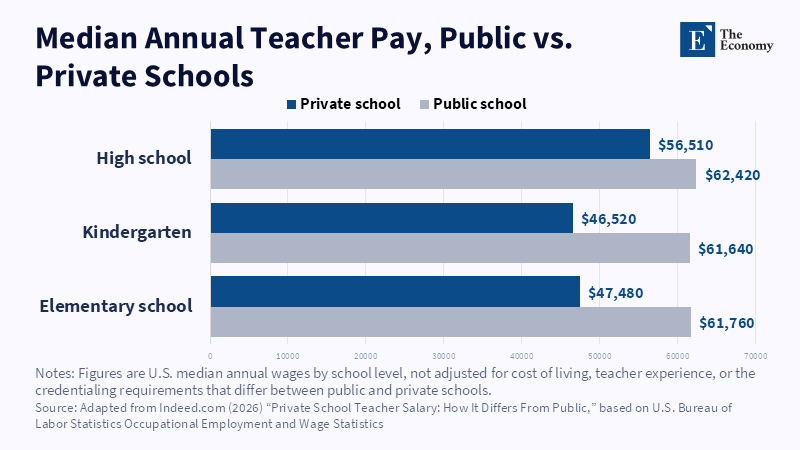
Figure: Private schools pay less than public schools at every grade level, despite competing more like a market, a sign that market pressure alone doesn't reward teaching skill either. Related Articles:
Read More