
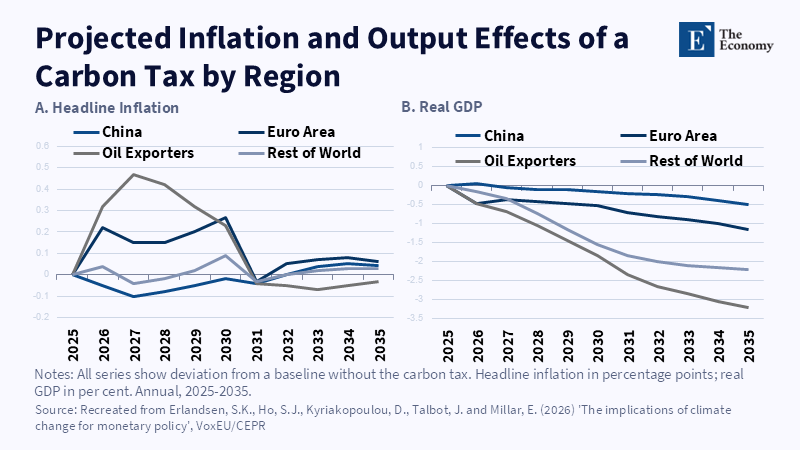
Figure 2: A carbon tax aligned with national targets lifts inflation and depresses output most in oil-exporting economies; advanced economies see smaller, shorter-lived effects. Relat
Read More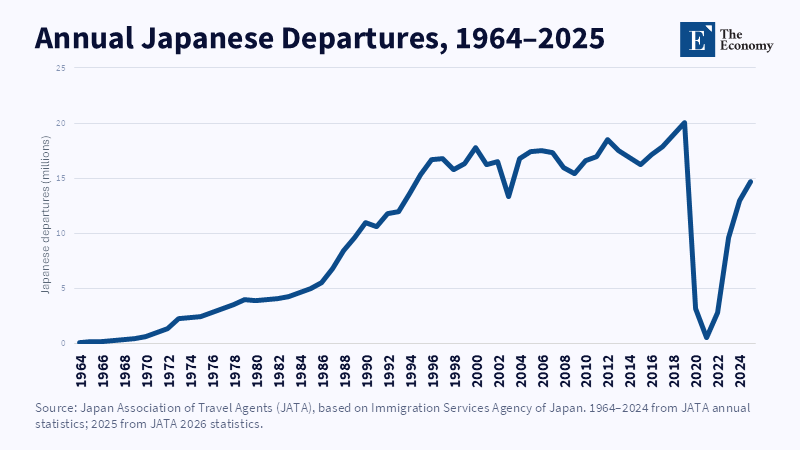
Figure 2: Japanese departures accelerated after 1985 and peaked in 2019. Related article: Weak Yen Explains
Read More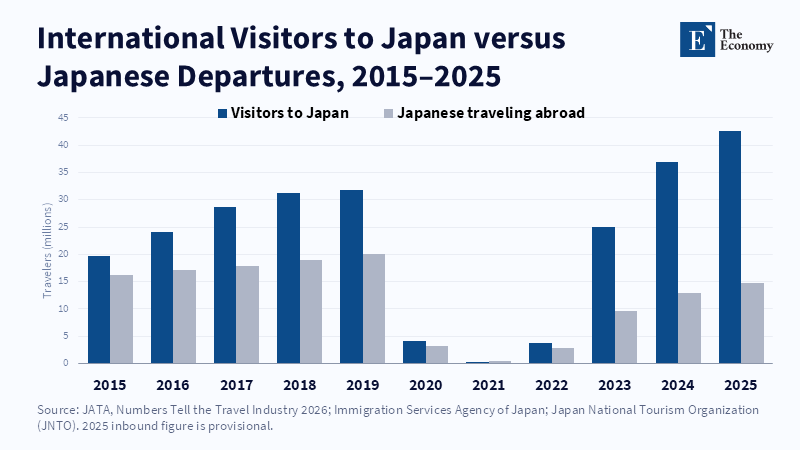
Figure 1: Inbound arrivals have surged while Japanese departures remain below 2019. Related article: Weak Ye
Read More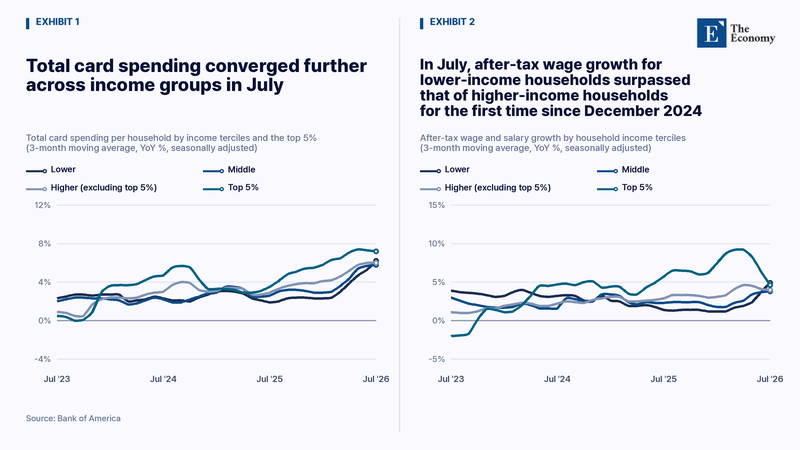
Note: In July, lower-income households’ after-tax wage growth surpassed that of higher-income households for the first time since December 2024, further narrowing the gap in card-spending growth. Related Articles:
Read More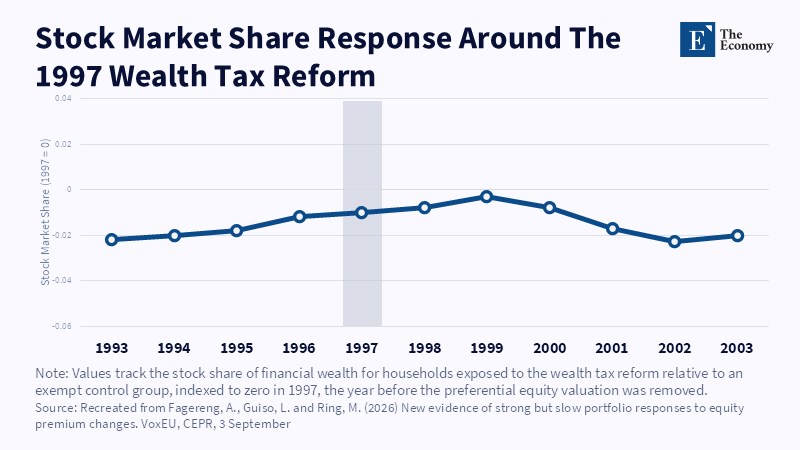
Figure 2: Affected households' stock share peaks in 1997, then drifts down over several years. Related article:
Read More







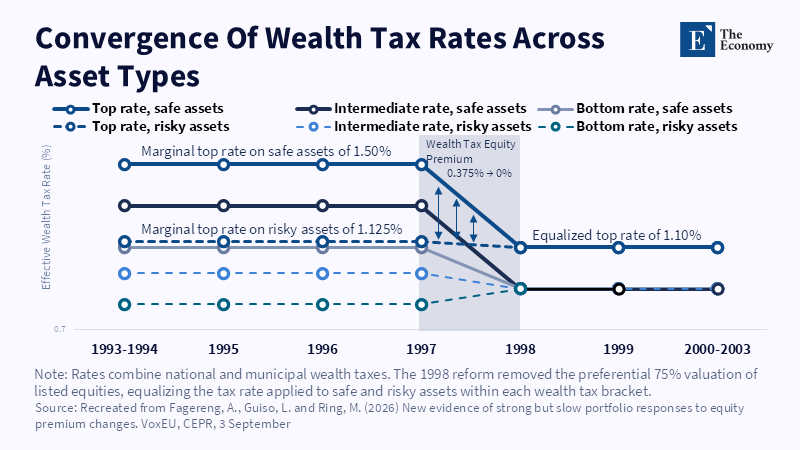
Figure 1: Wealth tax rates on safe and risky assets converge after the 1998 reform removed the valuation gap. Related article:
Read More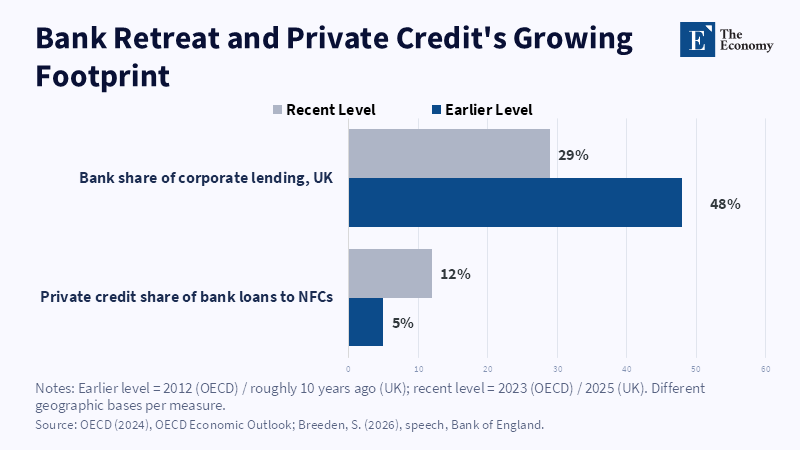
Figure 2: As banks' share of corporate lending fell, private credit's share of bank loans to non-financial corporations more than doubled.
Read More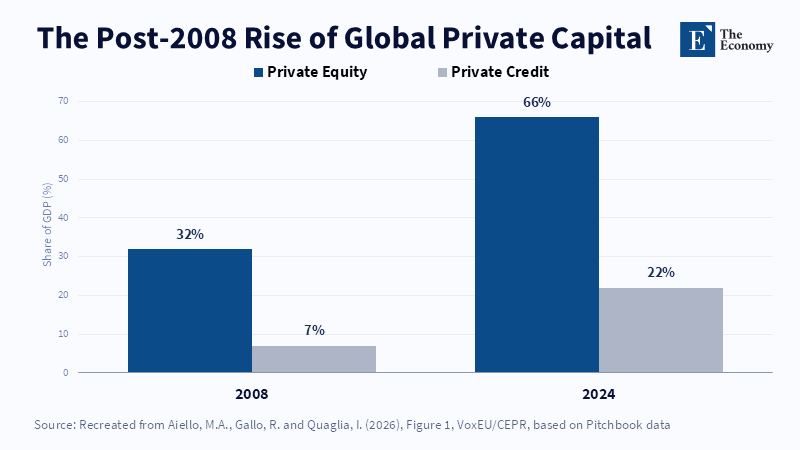
Figure 1: Private equity and private credit assets grew sharply relative to GDP between 2008 and 2024, with private credit nearly tripling its share. Related article:
Read More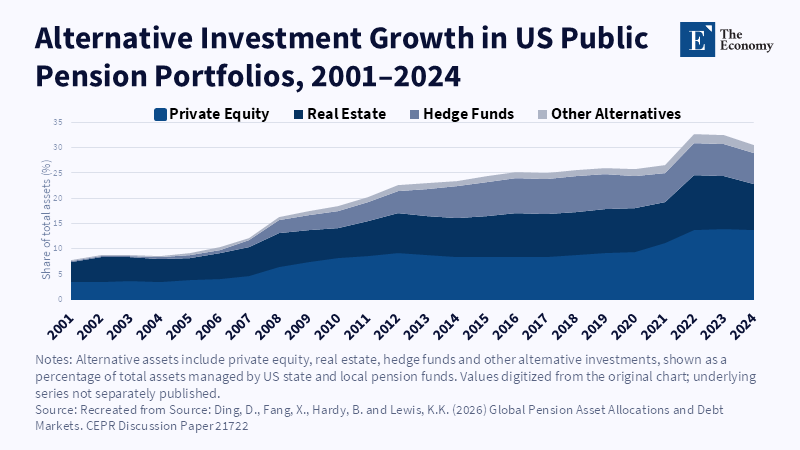
Figure 2: Alternative assets in US state and local pension portfolios have more than tripled since 2001, with the sharpest rise since 2021. Related article:
Read More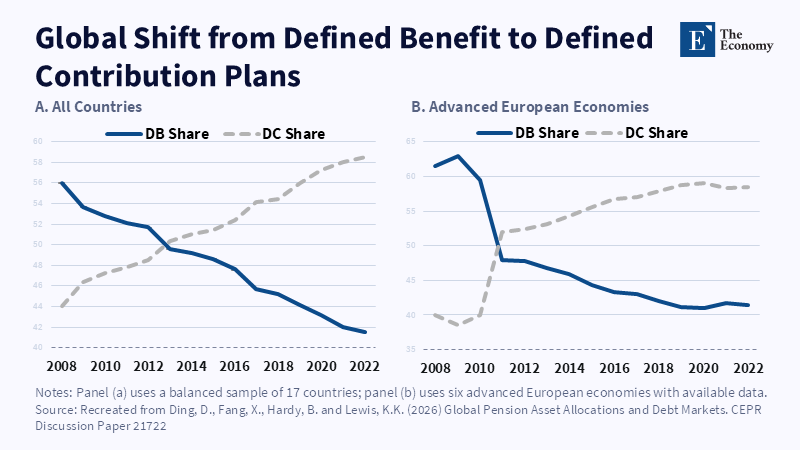
Figure 1: DB share falls below 50% globally around 2013; in advanced Europe, the same crossover happens abruptly near 2011.
Read More
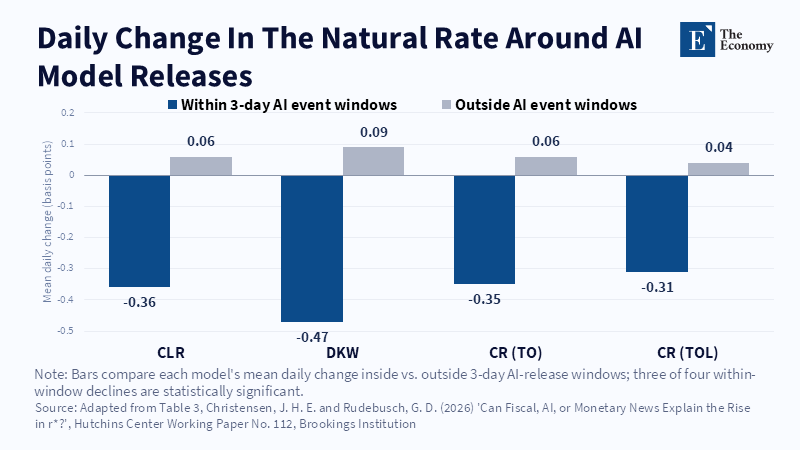
Figure 8: Fiscal news pushes r* up modestly; AI and Fed-meeting news both pull it down. Related article:
Read More
Figure 7: R* falls on AI-release days and edges up on all other days, the reverse of what a capital-demand story would predict. Related article:
Read More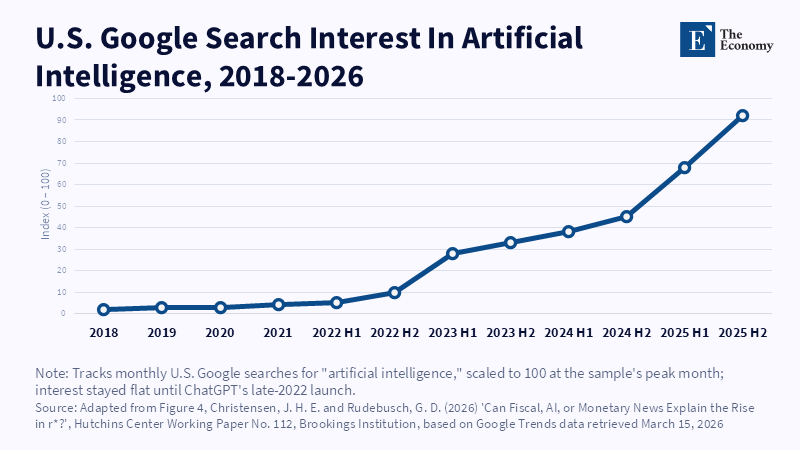
Figure 6: Public attention was flat for years, then surged after ChatGPT's late-2022 debut.
Read More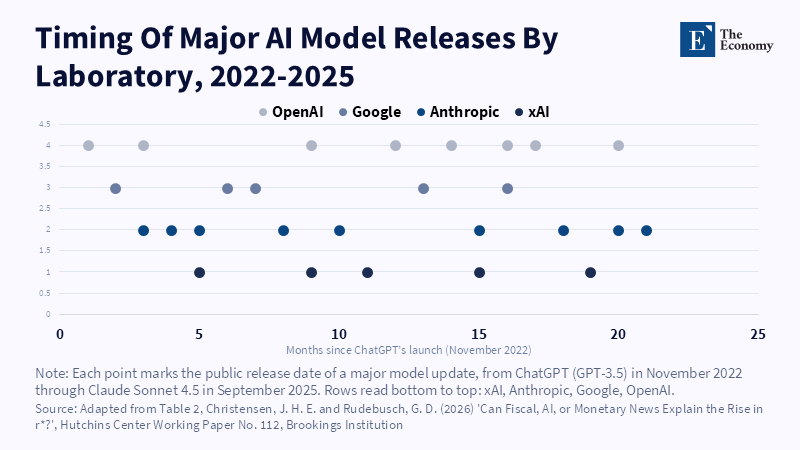
Figure 5: Four labs releasing major updates in overlapping waves, roughly every one to two months by 2024. Related article:
Read More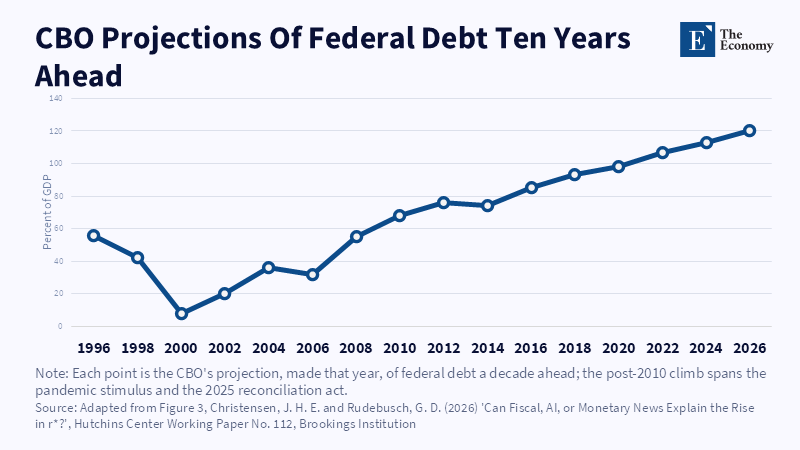
Figure 4: A decade-ahead debt forecast that has climbed almost without interruption since 2010. Related article:
Read More
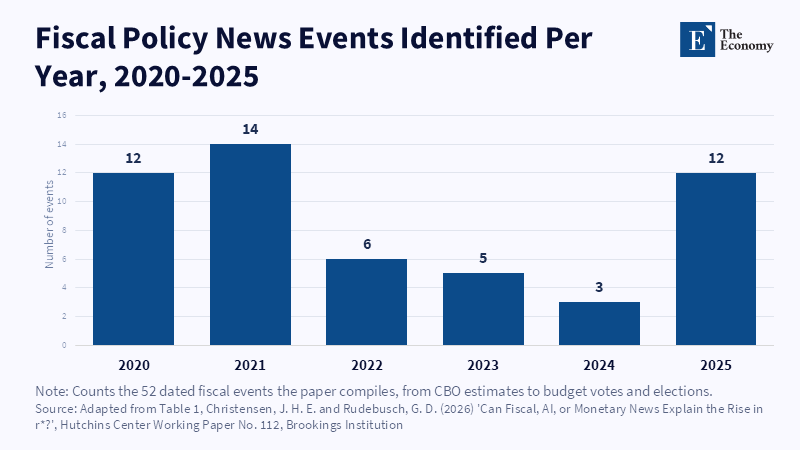
Figure 3: Fiscal news clusters around pandemic relief in 2020–21 and the reconciliation fight in 2025. Related article:
Read More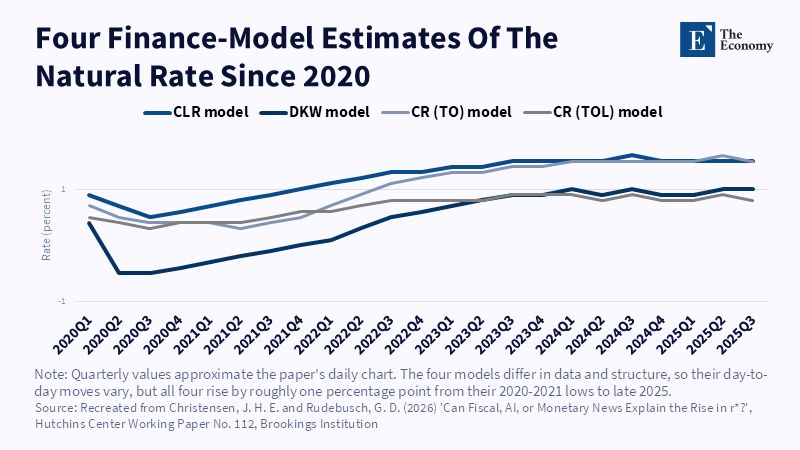
Figure 2: The four models disagree on level but move in the same direction since the 2020–21 lows. Related article:
Read More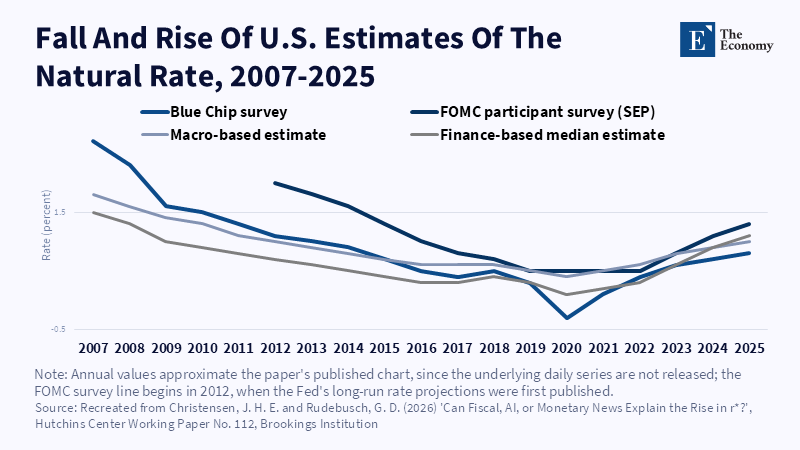
Figure 1: Four independent methods agree: r* fell for over a decade, then reversed by roughly a point after 2020. Related article:
Read More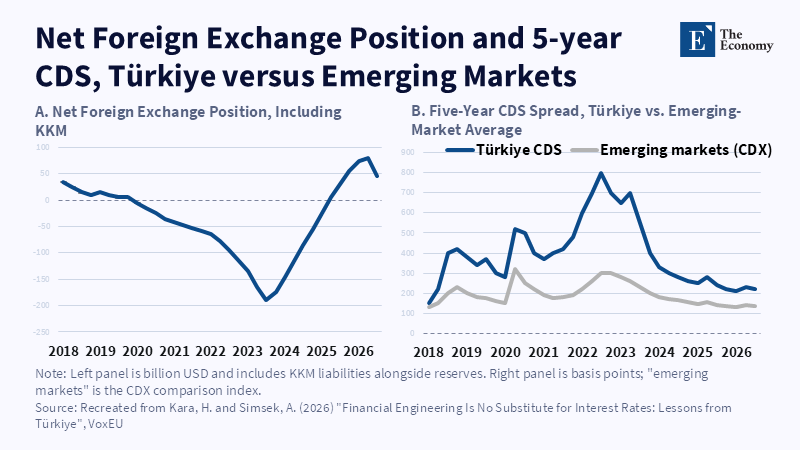
Figure 1: Fiscal exposure widened as KKM liabilities grew and investors priced the risk through 2023 Related article: Financia
Read More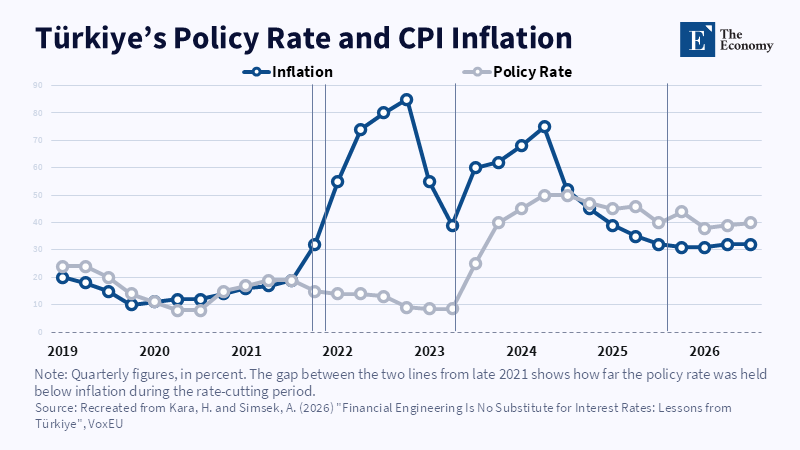
Figure 1: Rates fell as inflation climbed, then reversed once orthodoxy returned in 2023 Related article: Financial Engineering
Read More