
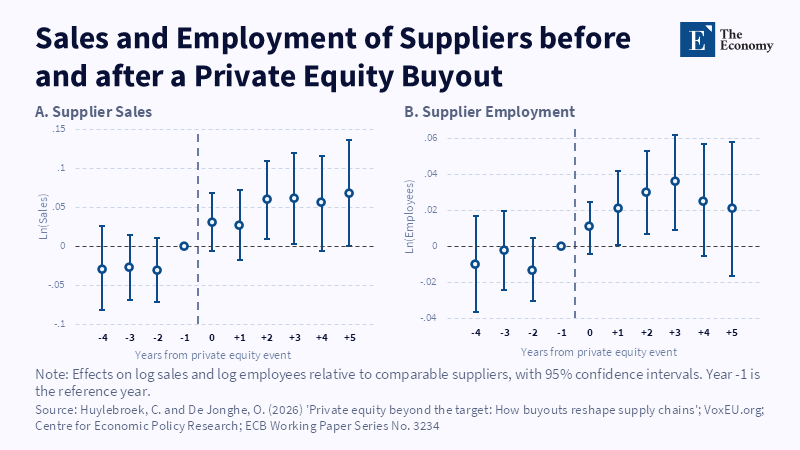
Figure: Suppliers show no gap before the buyout and pull ahead after it, more in sales than in jobs. Related articles: Merger Revi
Read More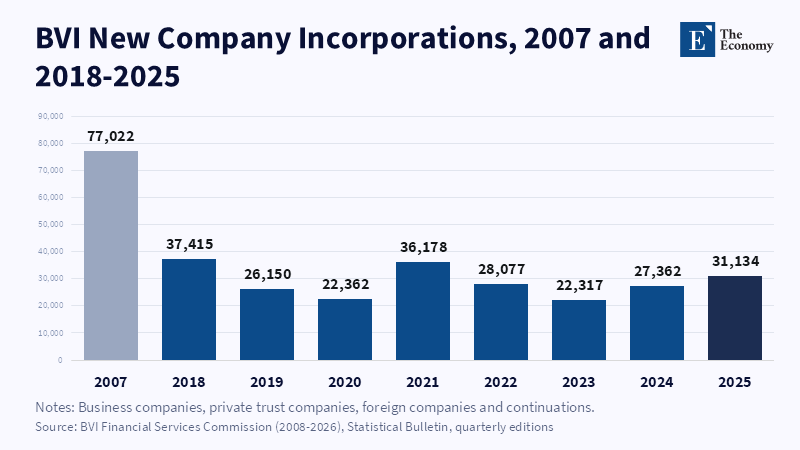
Figure: The 2025 rebound to 31,134 new companies still left BVI incorporations at 40% of their 2007 peak. Related articles: [Offshore Finance]
Read More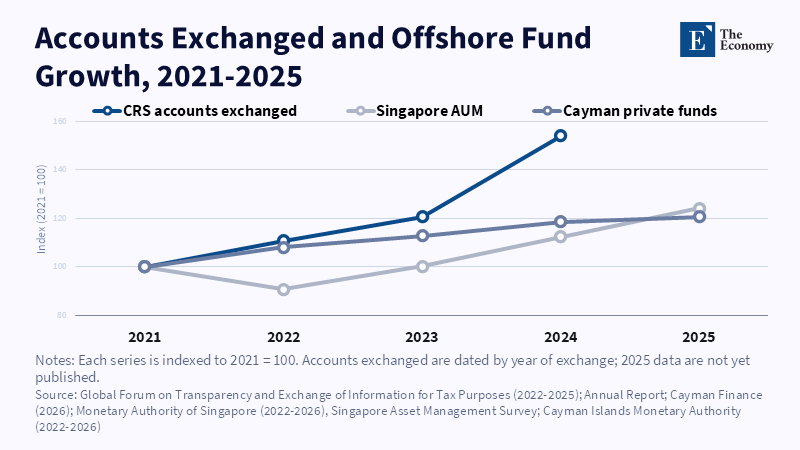
Figure: Accounts reported to tax authorities rose 54% between 2021 and 2024, while Cayman private funds grew 21% and Singapore’s managed assets 24% by 2025. Related articles:
Read More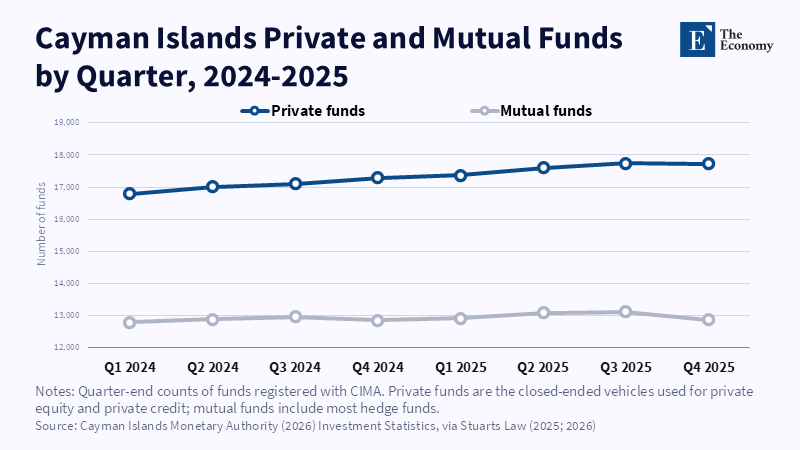
Figure: Cayman’s growth now comes from private capital.
Read More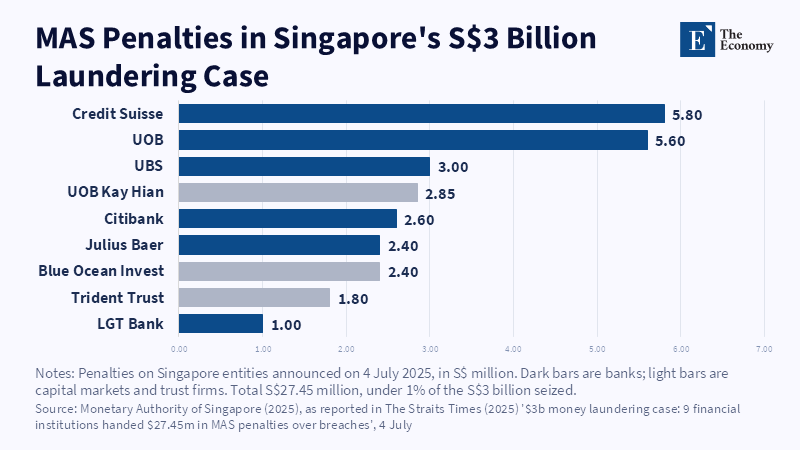
Figure: Nine institutions paid S$27.45 million between them, less than 1% of the assets seized. Related articles: [Offshore Finance] Not A
Read More







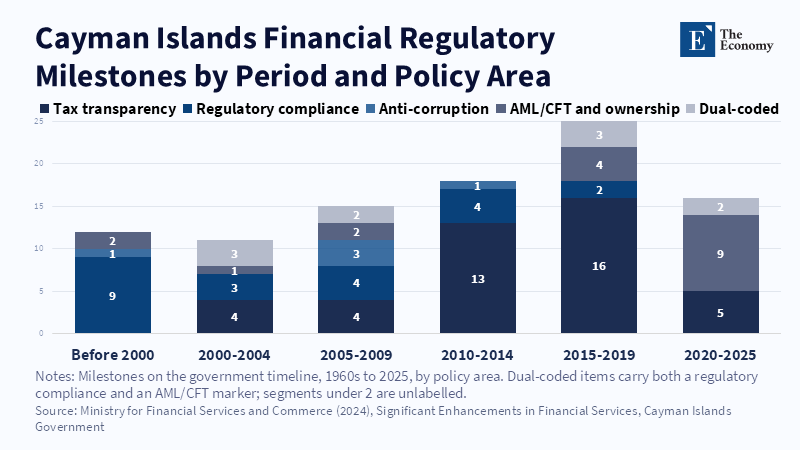
Figure: Tax transparency dominated the 2010s; after 2020 reform shifted almost entirely to anti-money laundering and beneficial ownership. Related articles:
Read More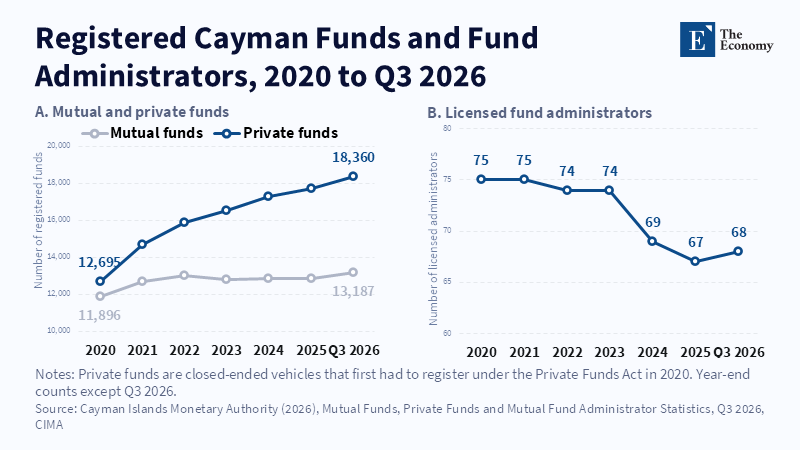
Figure: Private funds grew 45% while licensed administrators fell to 68, as compliance costs favoured larger providers. Related articles: [Offshor
Read More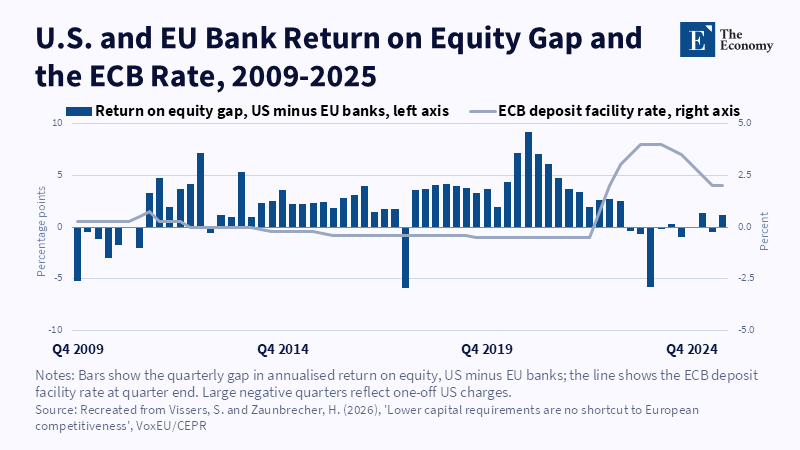
Figure: The profitability gap closed once rates rose, with no change to capital rules. Related articles: European Competitiveness: Capital Rules Built
Read More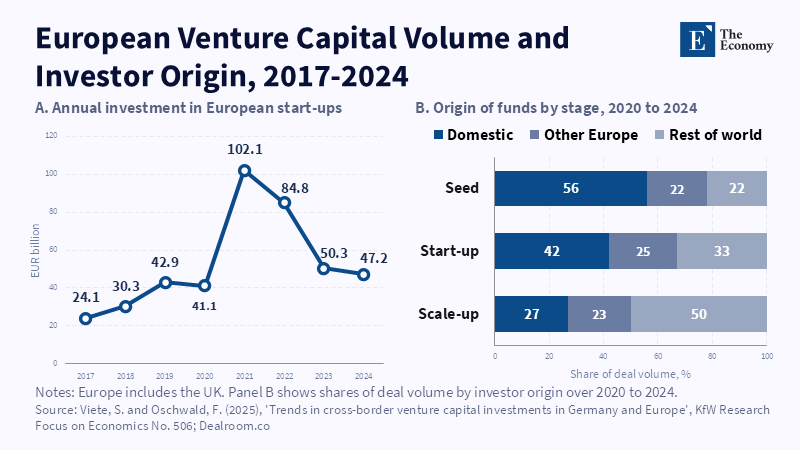
Figure: Funding halved after 2021, and scale-ups depend on capital from outside Europe. Related articles: European Competitiveness: Capital Rules Buil
Read More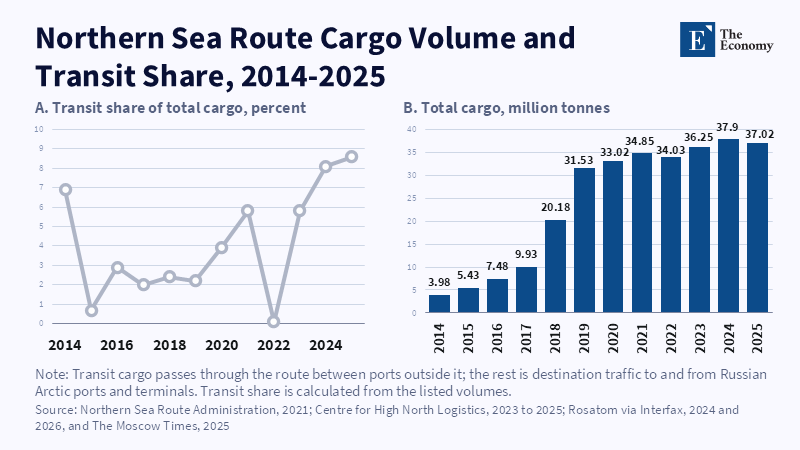
Figure: Cargo grew ninefold but transit never passed 9 percent. Related articles: [Arctic Maritime Strategy] Russia's Arctic Milit
Read More
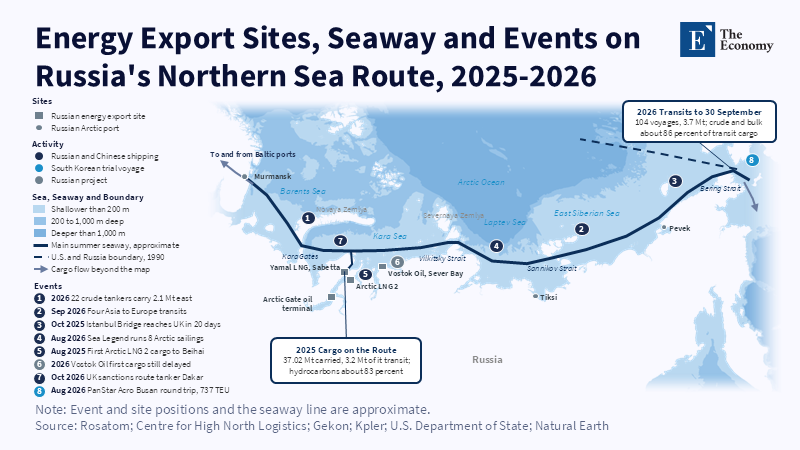
Figure: Export sites cluster at the Gulf of Ob; east of them the route thins to one seasonal lane. Related articles: [A
Read More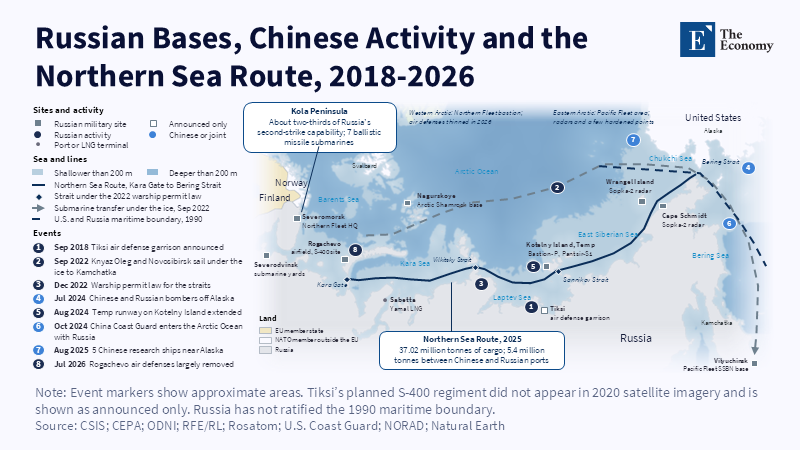
Figure: Russia guards Kola heavily; the eastern route is mostly watched, not defended. Related articles: [Arctic Maritime Strategy] Russ
Read More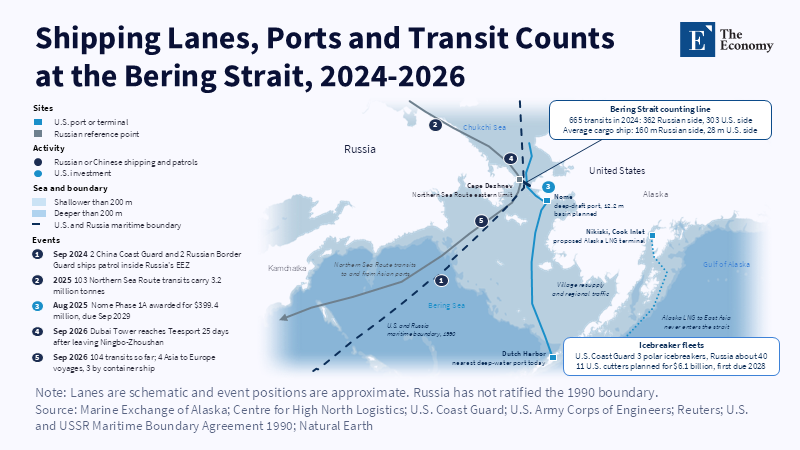
Figure: Russian energy runs down the western lane toward Asia, while Alaska’s side carries village resupply. Related articles: [Arcti
Read More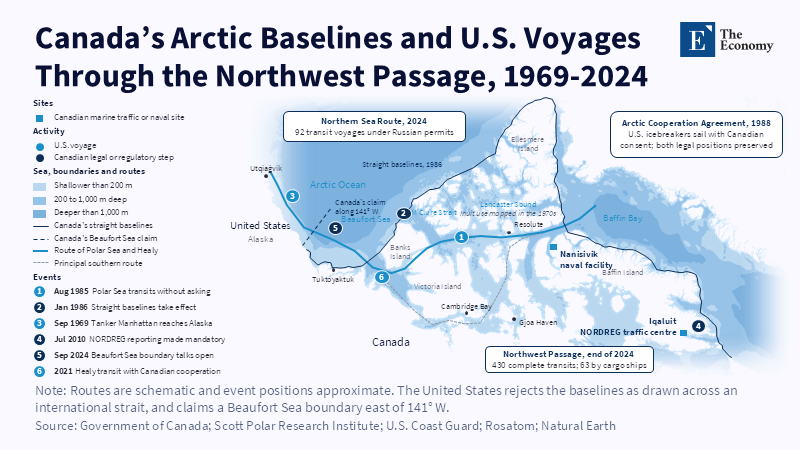
Figure: Canada’s baselines close both ends of the passage, so every U.S.
Read More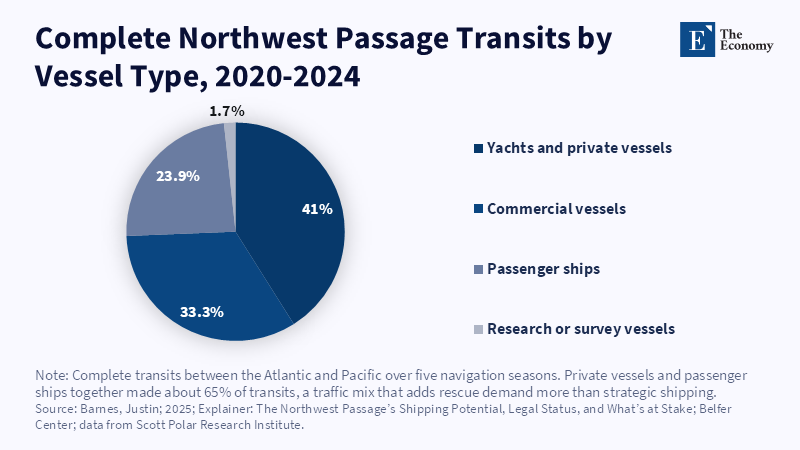
Figure: Most transits are private and passenger vessels, which adds rescue demand. Related articles: [Arctic Maritime Strategy] Canada’s Northwe
Read More
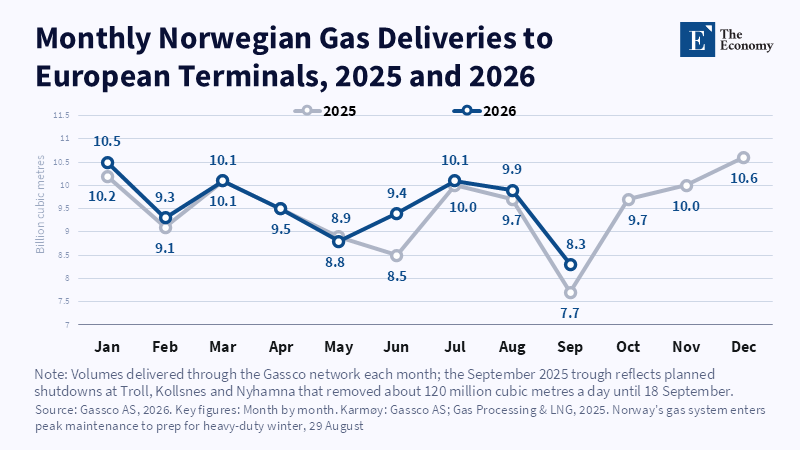
Figure: Planned September shutdowns cut flows by nearly a quarter, a preview of what an unplanned outage would do. Related articles:
Read More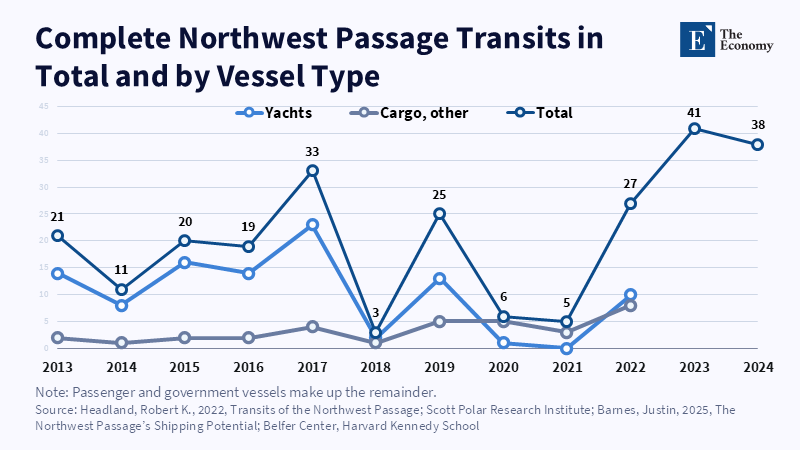
Figure: Yachts make up most transits, and cargo ships rarely exceed a handful a season.
Read More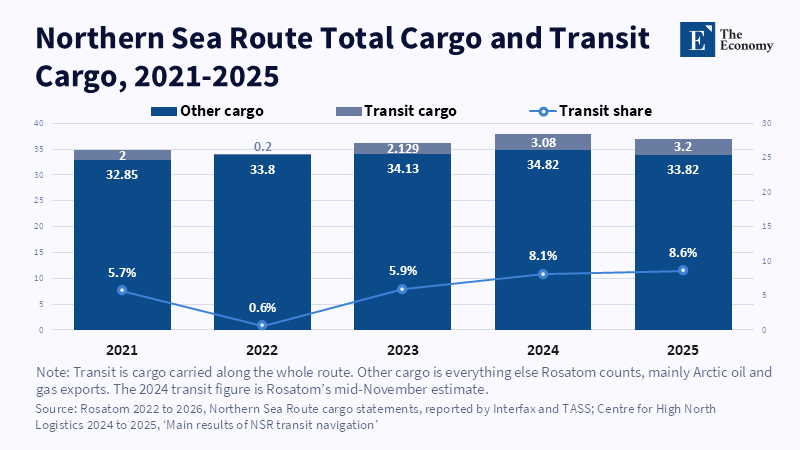
Figure: Transit hit a record 3.2 Mt in 2025, still under one tonne in eleven. Related articles: [Arctic Maritime Strat
Read More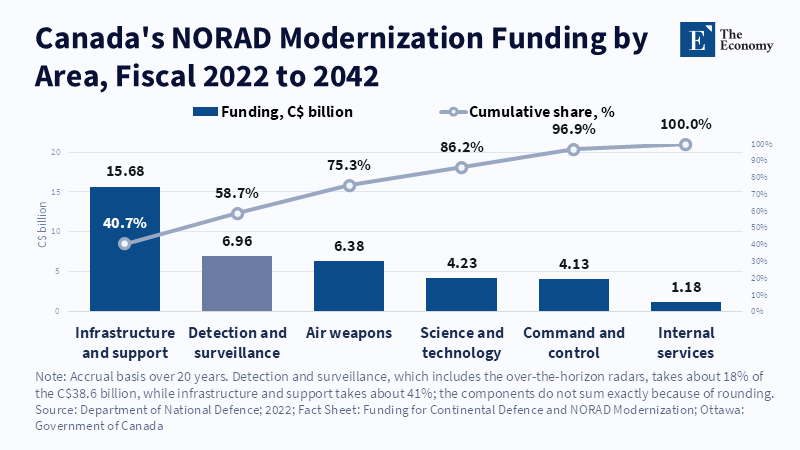
Figure: Only about 18% of the C$38.6 billion goes to detection and surveillance. Related articles: [Arctic Maritime Strategy] Canada’s Northwes
Read More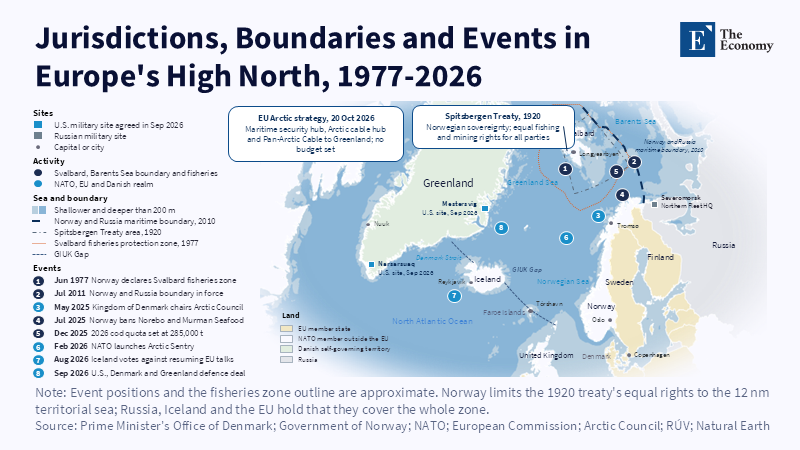
Figure: Every coastline around the GIUK Gap belongs to a NATO state, yet none of it is EU territory. Related articles: [Arctic Mar
Read More