
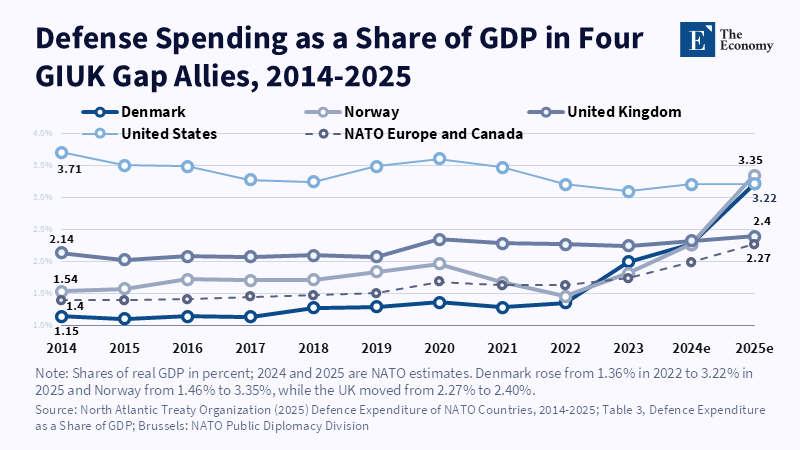
Figure: Denmark and Norway more than doubled spending shares after 2022, yet aircraft lag. Related articles: [Arctic Maritime Strategy] NATO
Read More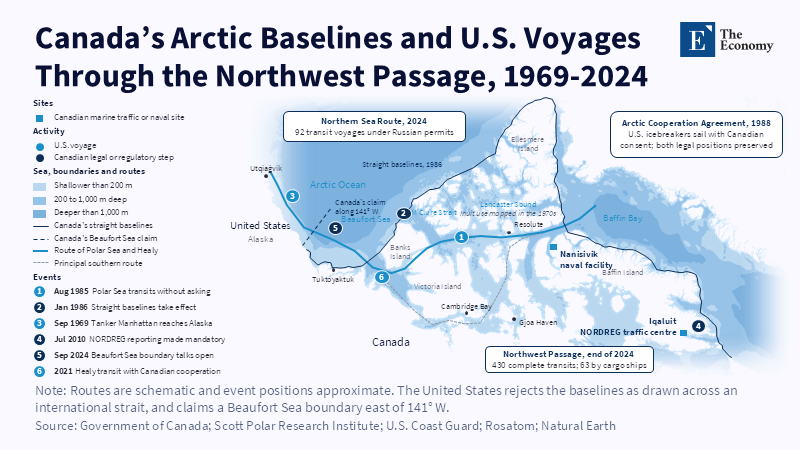
Figure: Canada’s baselines close both ends of the passage, so every U.S.
Read More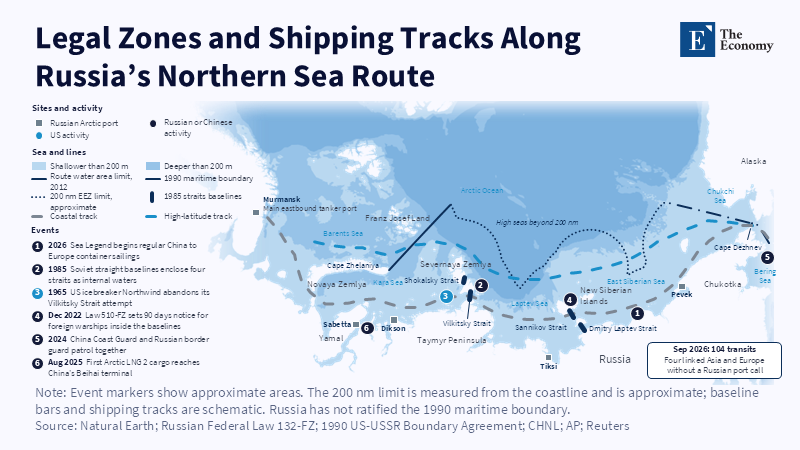
Figure: The coastal track runs through straits Moscow calls internal; northern tracks reach open sea. Related articles: [Arctic Mariti
Read More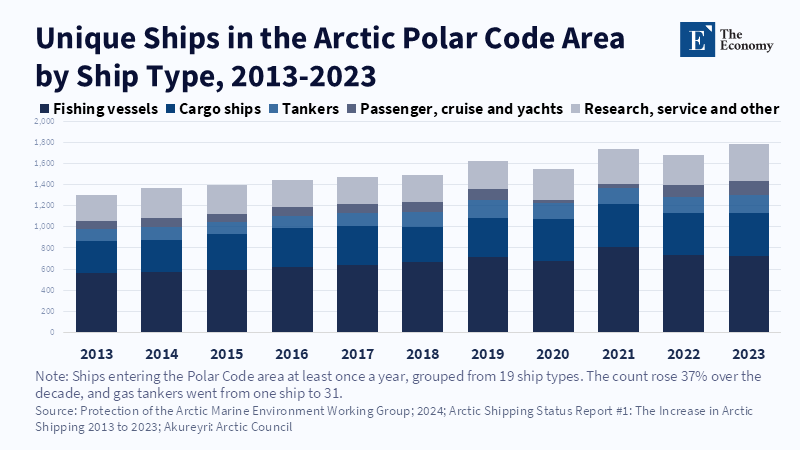
Figure: Arctic traffic rose 37 percent in a decade, which is why the 2018 routes matter. Related articles: [Arctic Maritime Strategy] Sover
Read More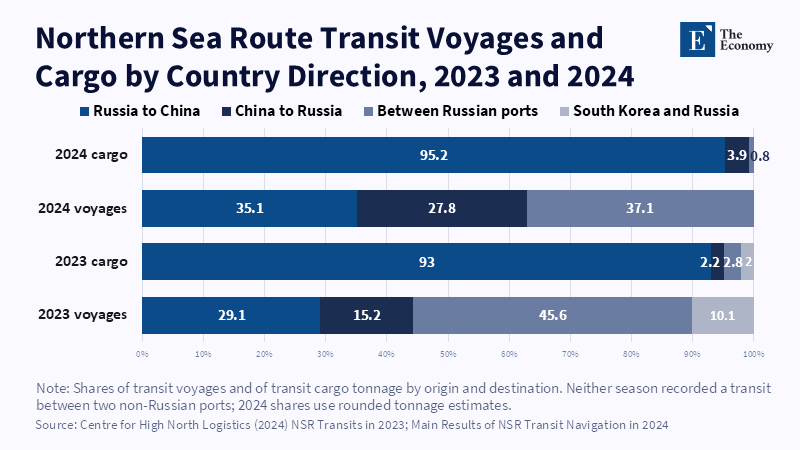
Figure: Russia-to-China sailings are a third of voyages but 93 to 95% of cargo. Related articles: [Arctic Maritime Strategy] Control
Read More







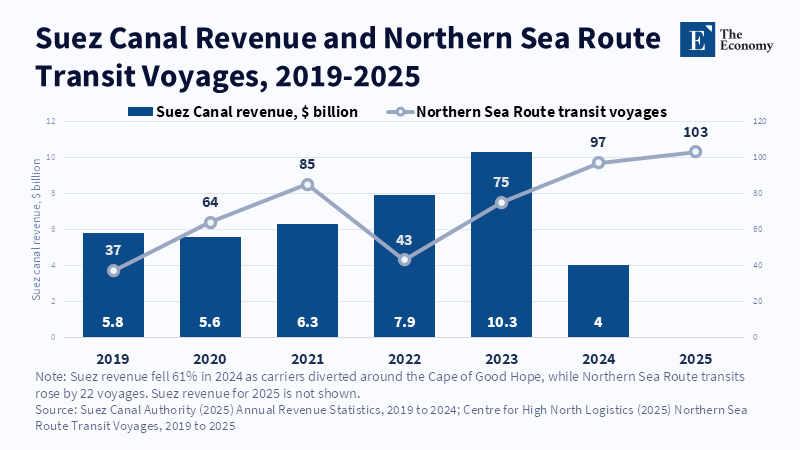
Figure: Suez lost $6.3 billion in 2024, while the Arctic gained just 22 voyages. Related articles: [Arctic Maritime Strategy] The E
Read More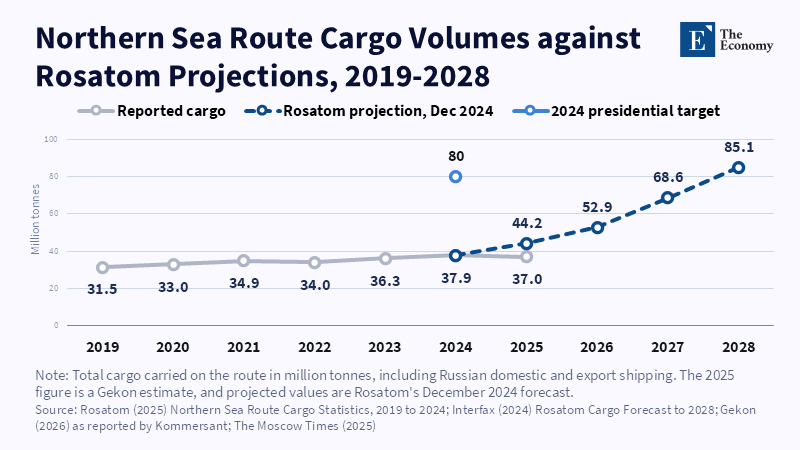
Figure: Cargo has flattened near 37 million tonnes while Rosatom’s forecast needs it to more than double by 2028. Related articles:
Read More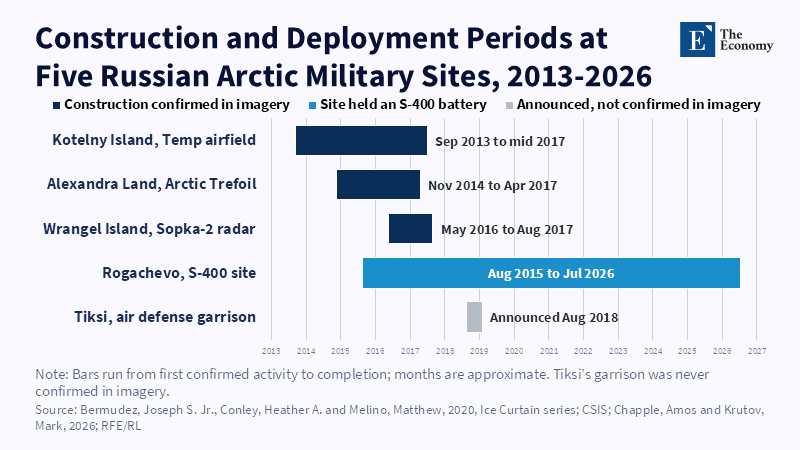
Figure: Eastern bases were finished before transit traffic existed. Related articles: [Arctic Maritime Strategy] Russia's Arctic
Read More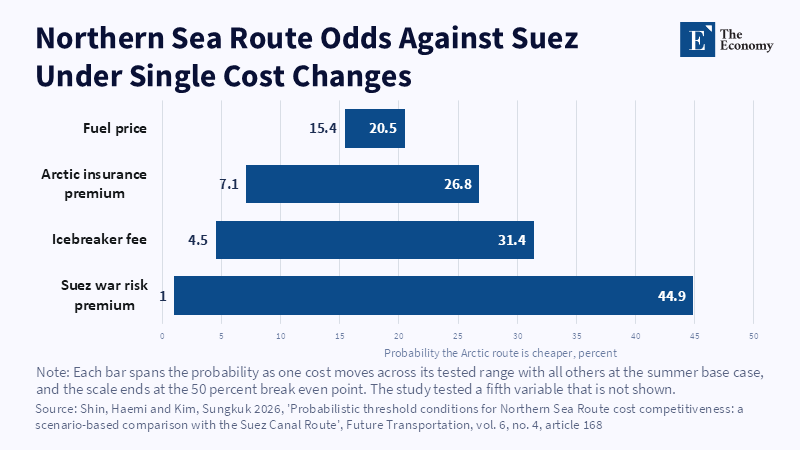
Figure: Even a full Red Sea war-risk premium leaves the Arctic route short of even odds. Related articles: [Arctic Ma
Read More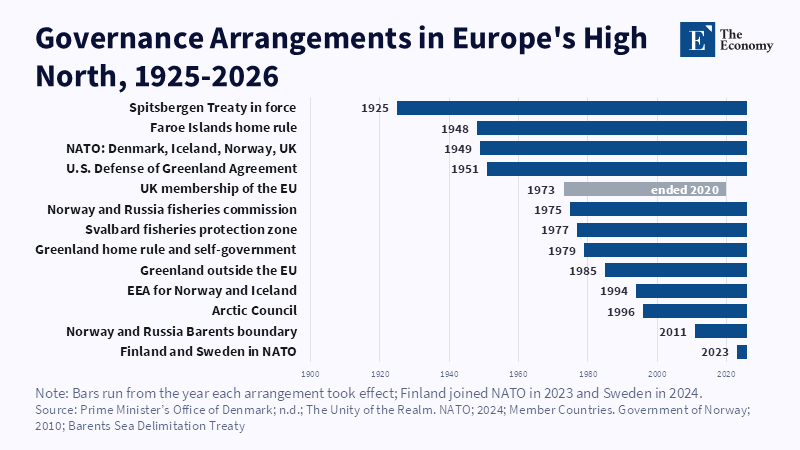
Figure: Most governance layers are decades old; newer security deals sit on top. Related articles: [Arctic Maritime Strategy] Who
Read More
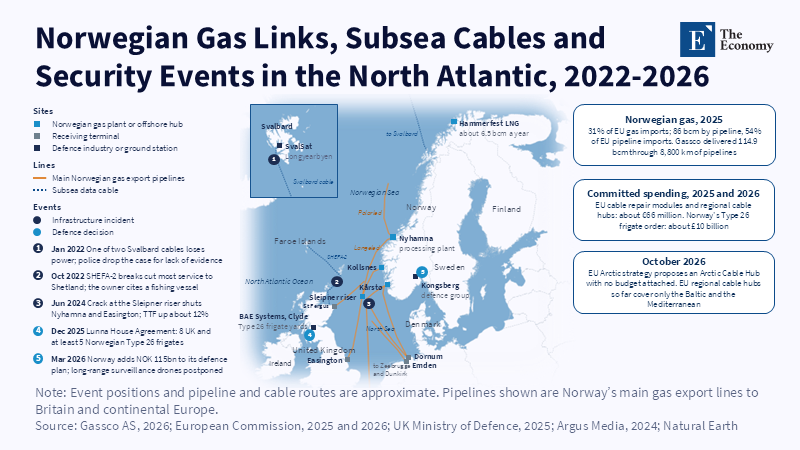
Figure: Europe’s gas and data lifelines converge on a few Norwegian and British points, and the documented incidents so far trace back to accidents. Related articles:
Read More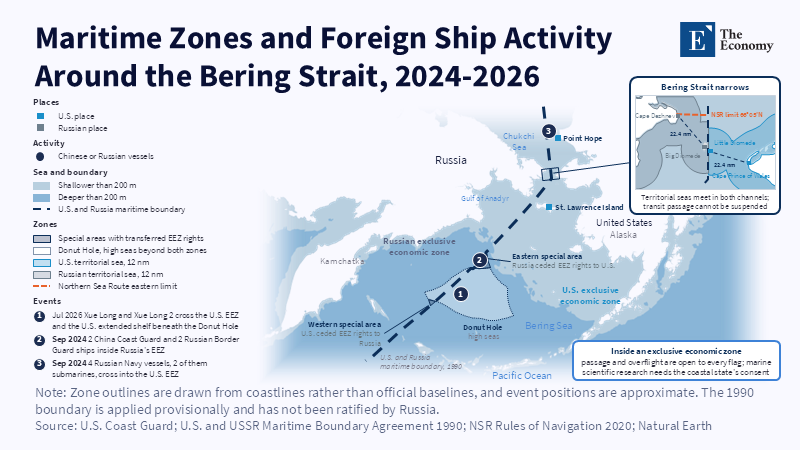
Figure: All three encounters happened in economic zones, where passage is lawful. Related articles: [Arctic Maritime Strategy] Sovereignty,
Read More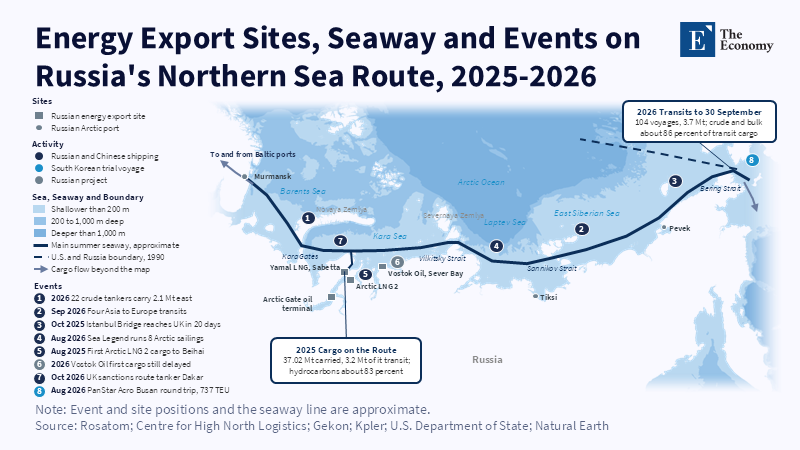
Figure: Export sites cluster at the Gulf of Ob; east of them the route thins to one seasonal lane. Related articles: [A
Read More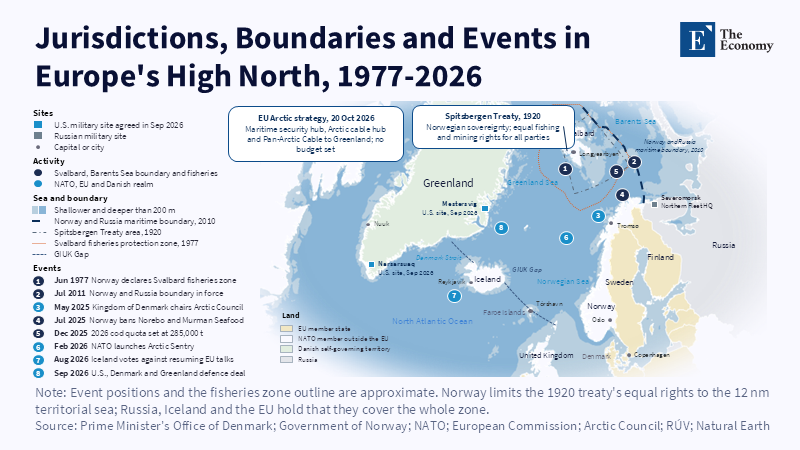
Figure: Every coastline around the GIUK Gap belongs to a NATO state, yet none of it is EU territory. Related articles: [Arctic Mar
Read More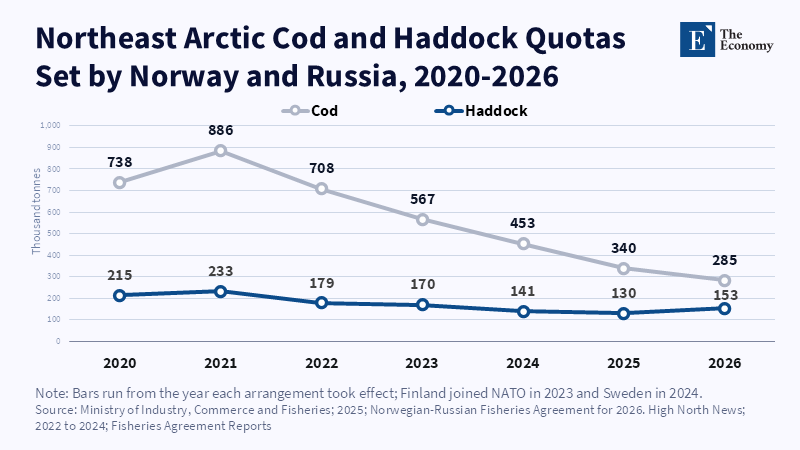
Figure: Joint quota-setting continued every year after February 2022, even as cod was cut by half. Related articles: [Arctic Mar
Read More
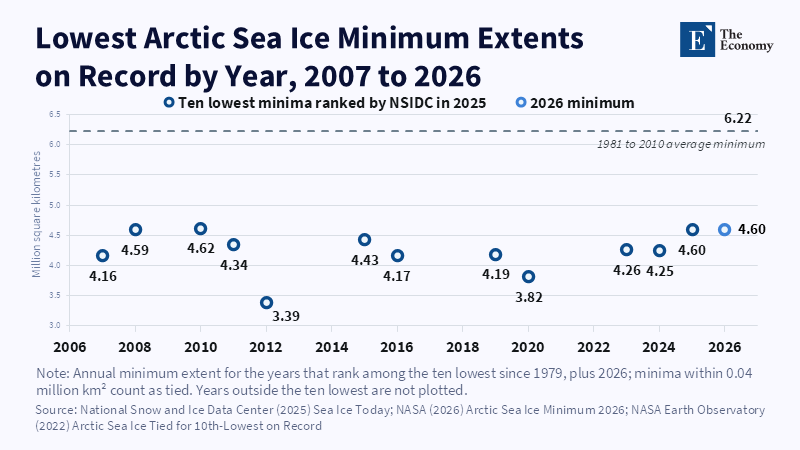
Figure: A decade without further retreat keeps Russia’s ice-based claim intact for now. Related articles: [Arctic Maritime Strategy]
Read More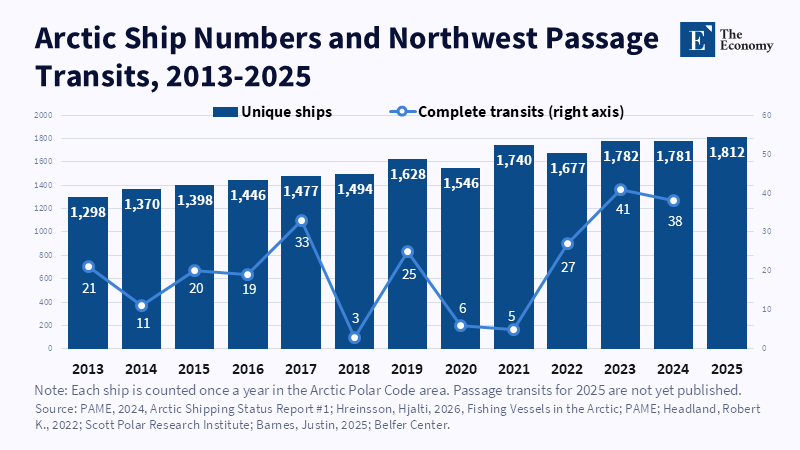
Figure: Arctic shipping grew 40 percent in twelve years, yet passage transits swung between 3 and 41 with ice and Canadian rules. Related articles:
Read More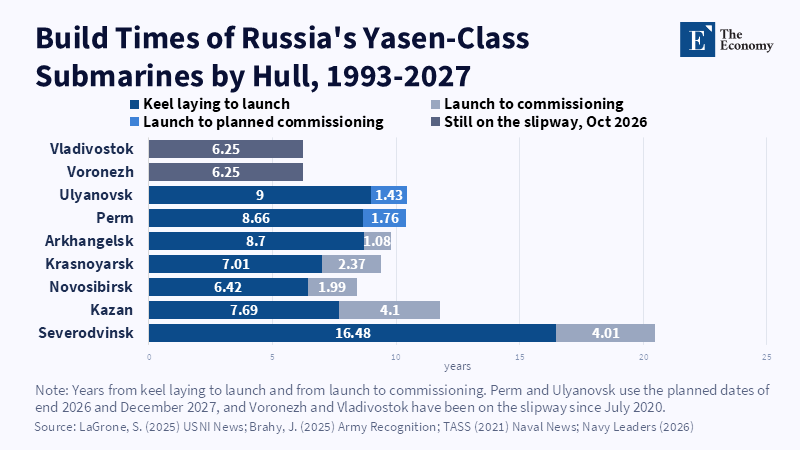
Figure: Severodvinsk took over 20 years; every Yasen-M since has taken under 12. Related articles: [Arctic Maritime Strategy] NATO’s Northern
Read More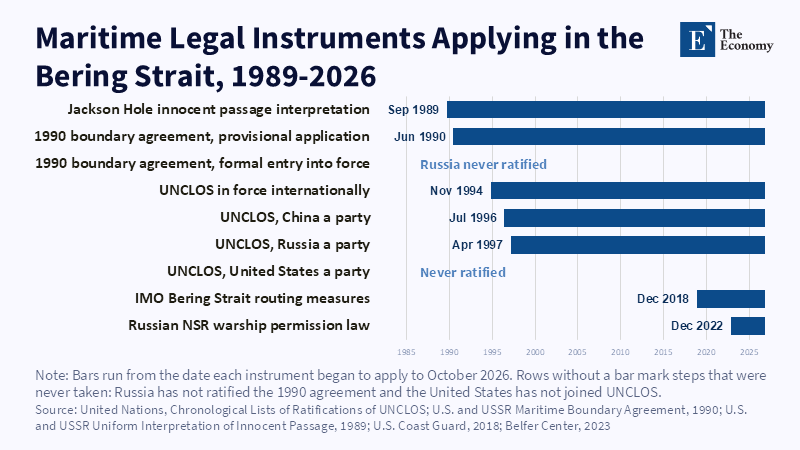
Figure: The boundary Russia never ratified has applied longer than UNCLOS has bound Russia or China. Related articles: [Arctic Maritime St
Read More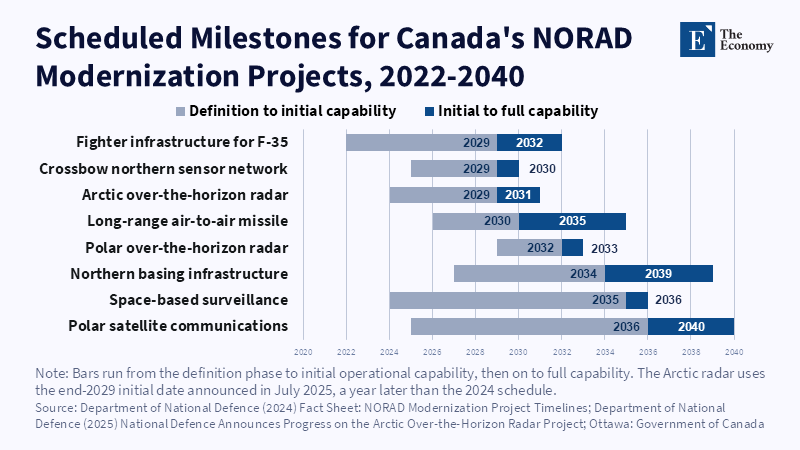
Figure: Canada brings radars and satellites first, and its maritime capability mostly arrives after 2030. Related articles: [Arctic M
Read More