
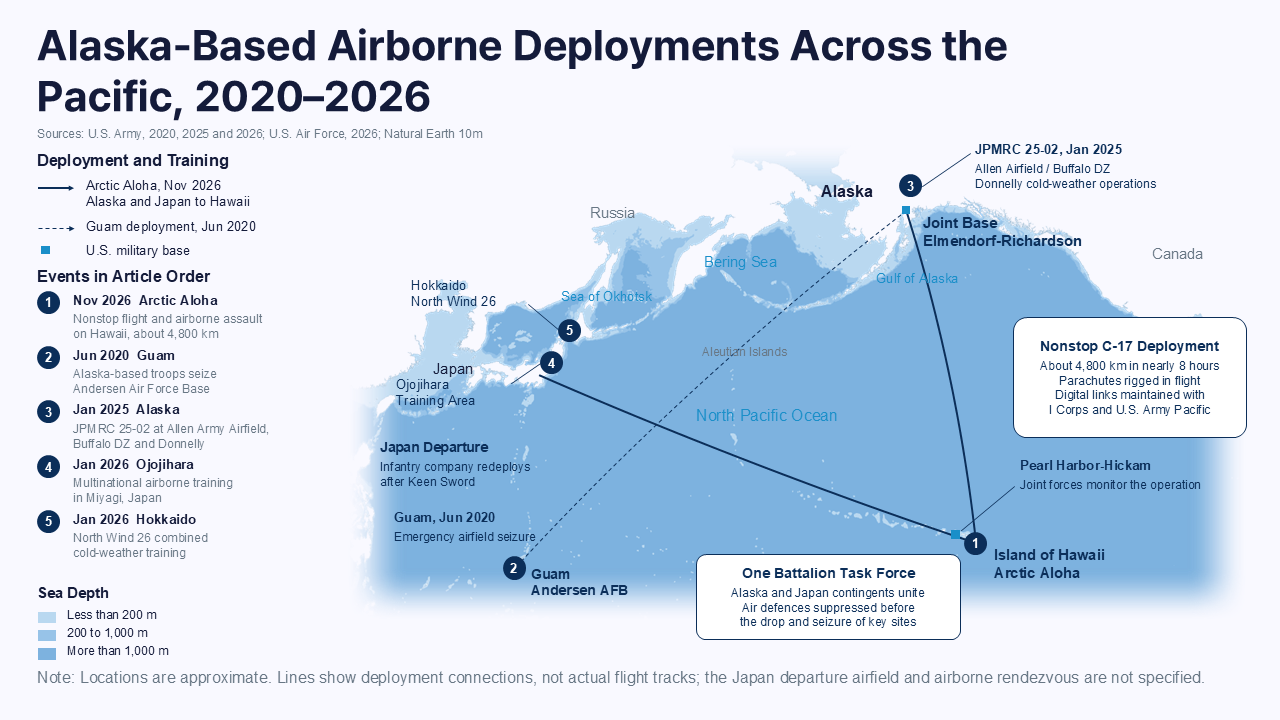
Related articles: Flying 4,800 km, parachuting in and heading straight into battle: Alaska-based U.S.
Read More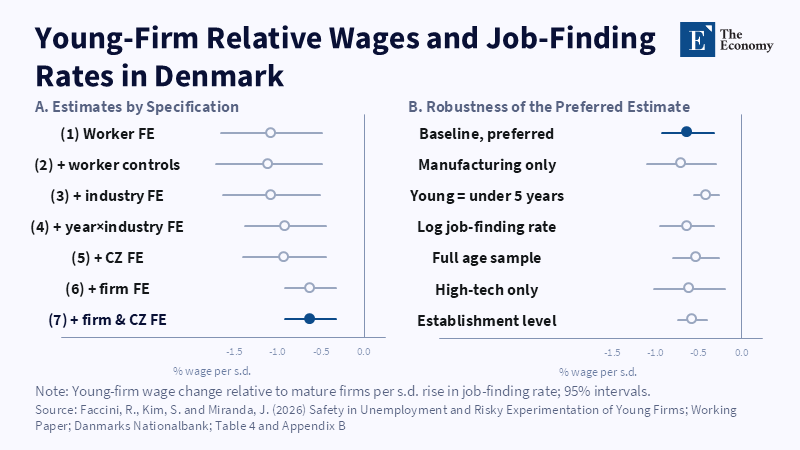
Figure: In every specification, young firms pay less relative to mature firms where jobs are easier to find. Related articles: Europe's Innova
Read More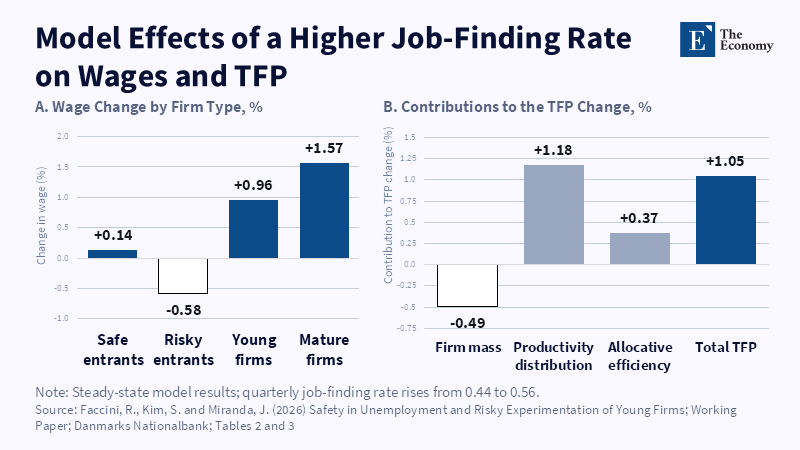
Figure: Faster re-employment cuts pay at risky entrants and lifts aggregate productivity by about 1% in the model. Related articles: Europe's
Read More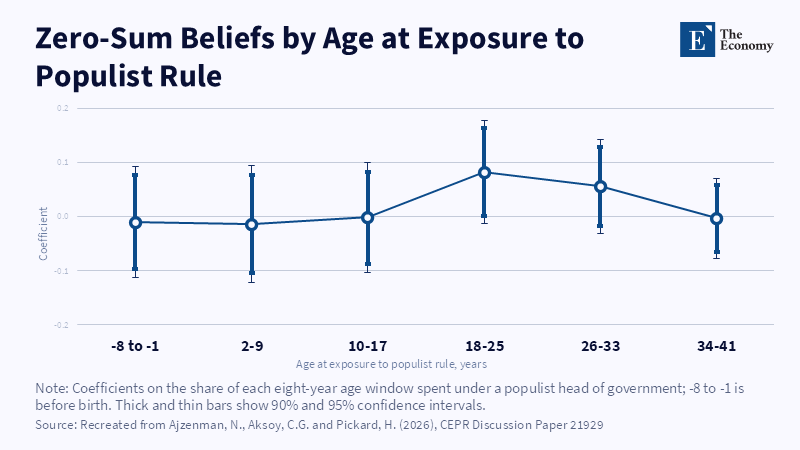
Figure: Populist rule raises zero-sum beliefs only when experienced between ages 18 and 25. Related articles: Populism's Zero-Sum Legacy:
Read More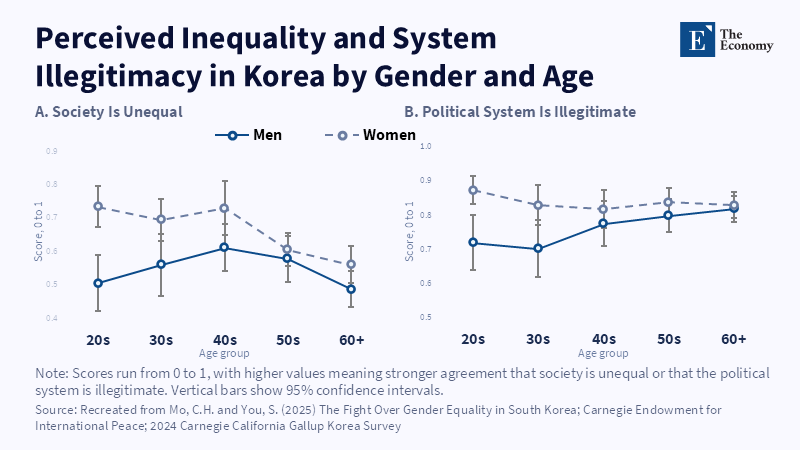
Figure: Young Korean women see the most inequality; young men among the least. Related articles: Populism's Zero-Sum Legacy: Political R
Read More







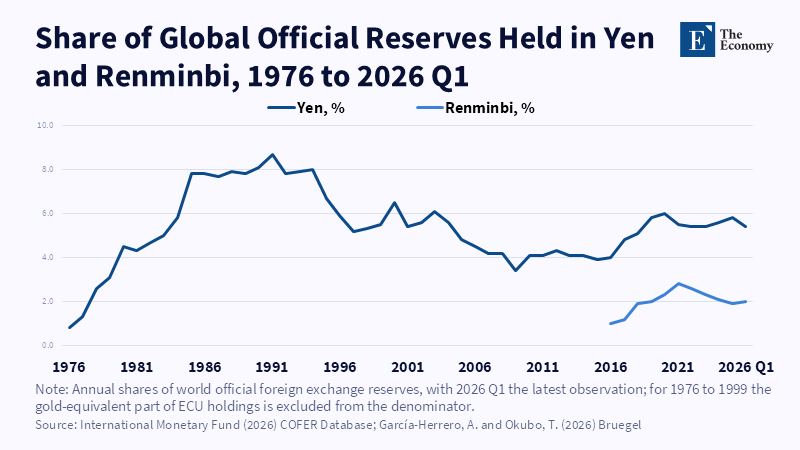
Figure: Even after Japan opened up, the yen peaked below 9%.
Read More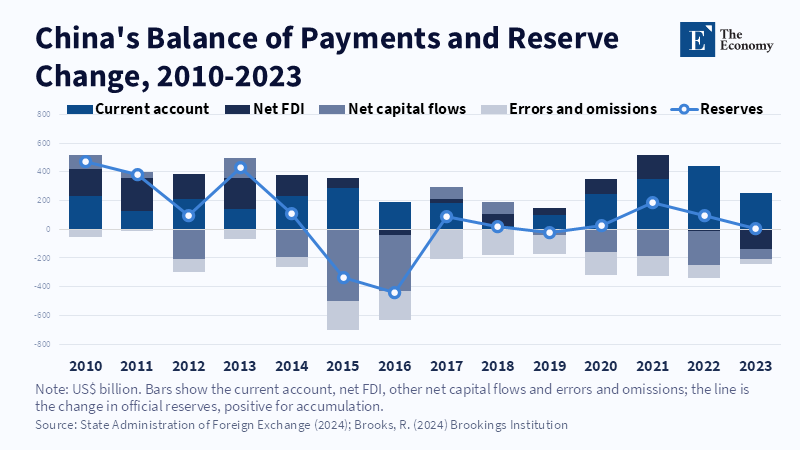
Figure: Capital outflows overwhelmed the current-account surplus in 2015 and 2016. Related articles: The Renminbi's
Read More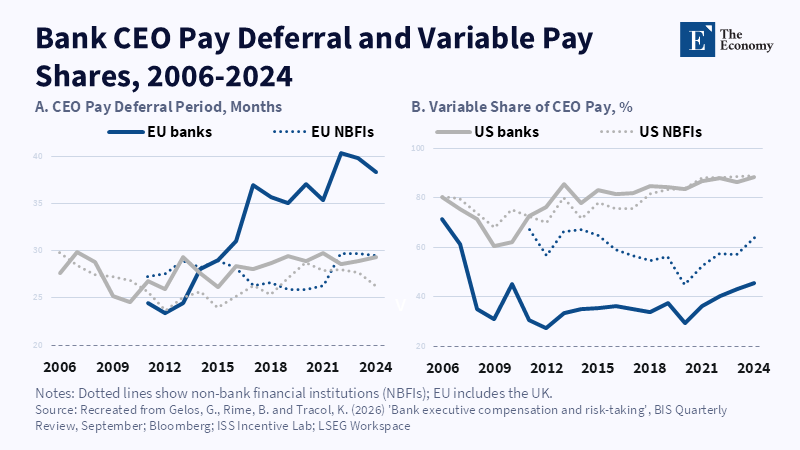
Figure: European banks lengthened CEO deferral after 2016; U.S.
Read More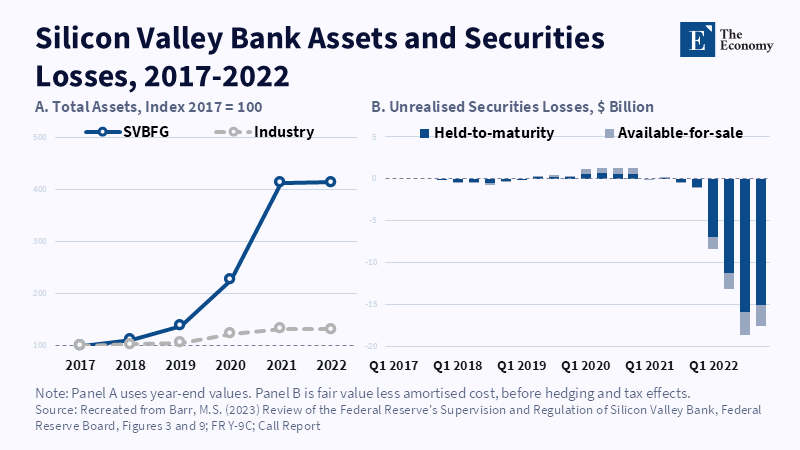
Figure: SVB quadrupled its assets, then its securities losses built up within 2022. Related articles: Bank Executive Compensation in the Age of D
Read More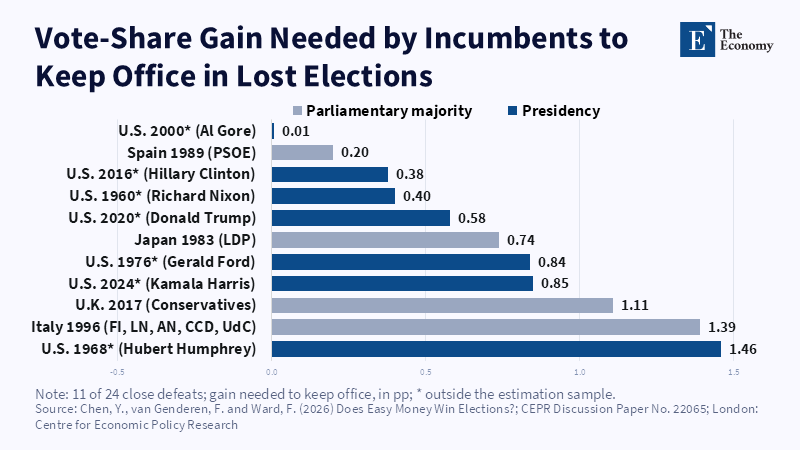
Figure: Most defeated incumbents needed more than any typical easing could deliver. Related articles: Easy Money May Not Win Elections, but Its Ec
Read More
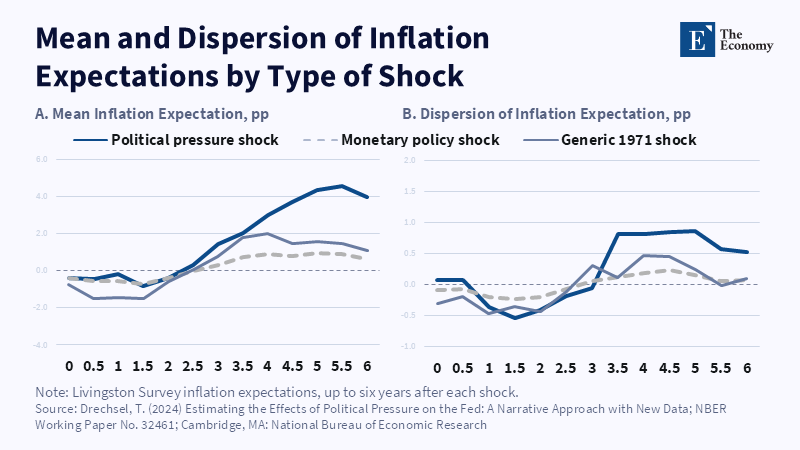
Figure: Political pressure lifts expectations further and wider than ordinary easing. Related articles: Easy Money May Not Win Elections, but Its
Read More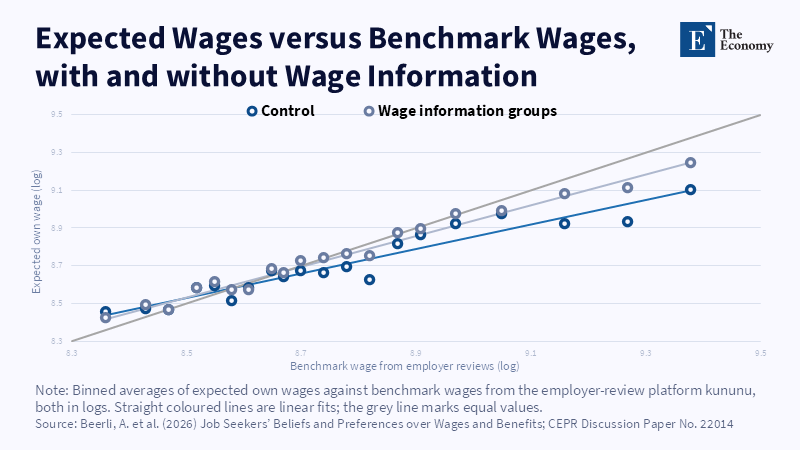
Figure: Both groups understate how widely wages vary and displaying wages helps people understand this better.
Read More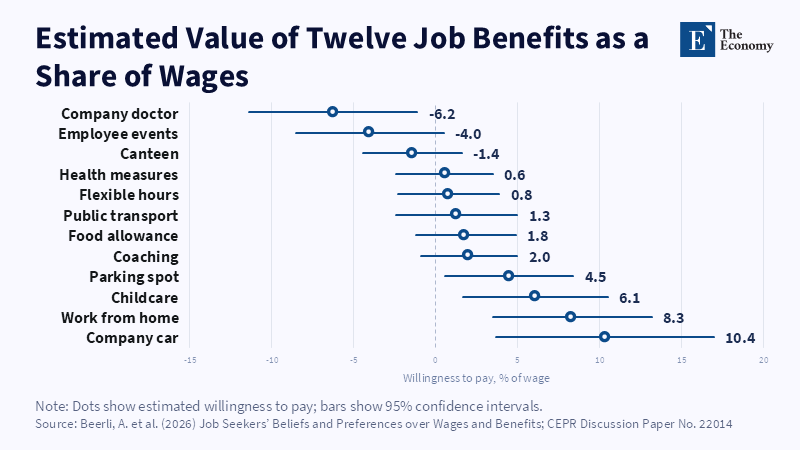
Figure: Only four of these twelve benefits were found to carry clear value. Related articles: Pay Transparency Meets a Labor Market That Is Hiring Les
Read More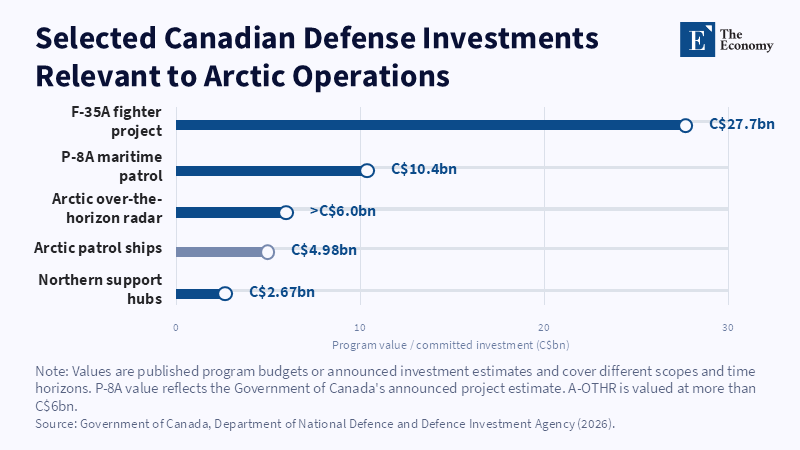
Figure: Canada's Arctic buildup combines major platforms with the infrastructure needed to sustain them. Related articles: [Arctic
Read More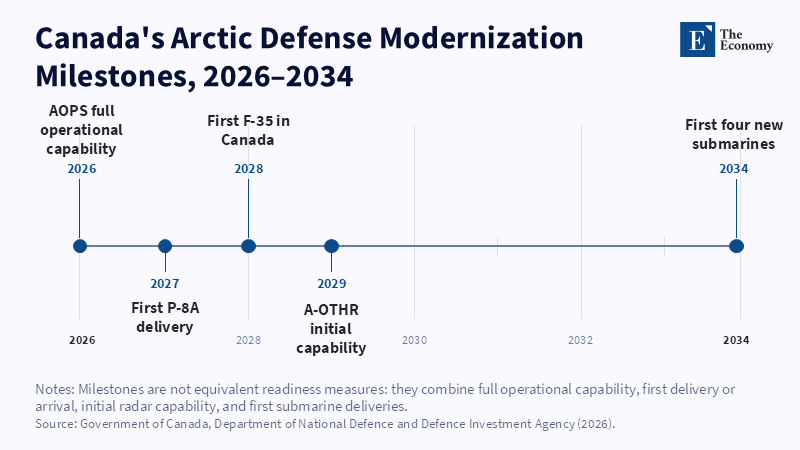
Figure: Canada's modernization arrives in stages, extending the integration challenge well into the 2030s. Related articles: [A
Read More
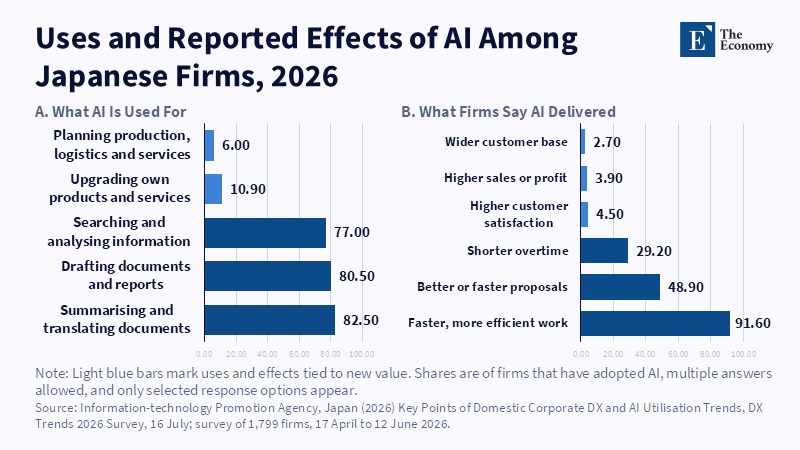
Figure: AI delivers efficiency gains more frequently than higher sales or profitability. Related articles: Japan SME Digitalization Has to Reach the
Read More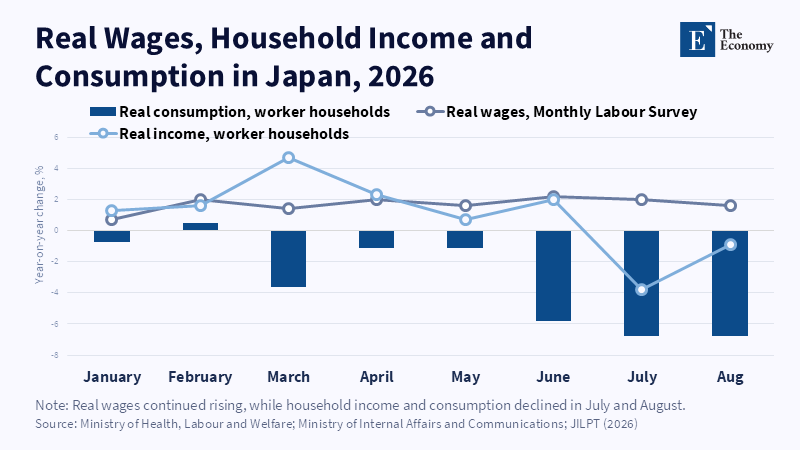
Figure: Rising real wages have not consistently translated into stronger household income and consumption. Related articles: Japan SME Digitalization
Read More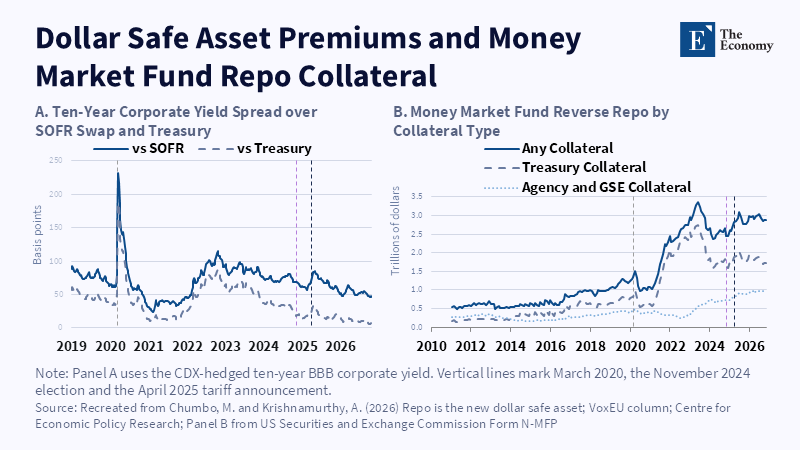
Figure: The convenience premium on long-term Treasuries has declined, while money market funds have increasingly used agency and GSE repo collateral. Related articles:
Read More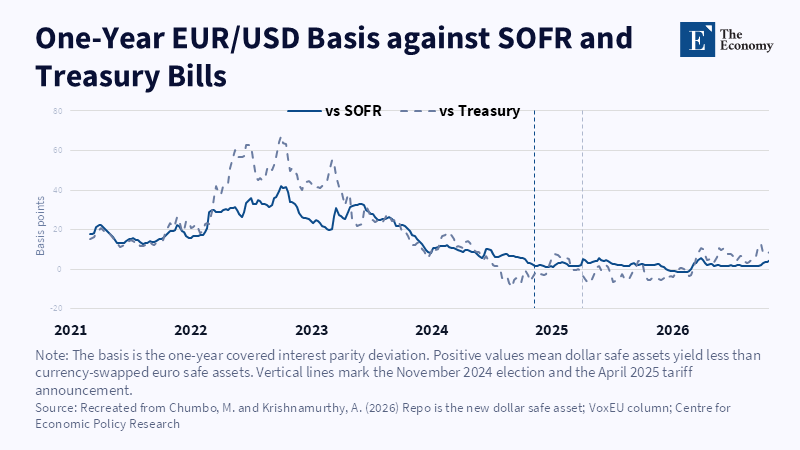
Figure: The dollar safe-asset premium against euro alternatives has narrowed substantially since 2022, approaching zero in recent years. Related articles:
Read More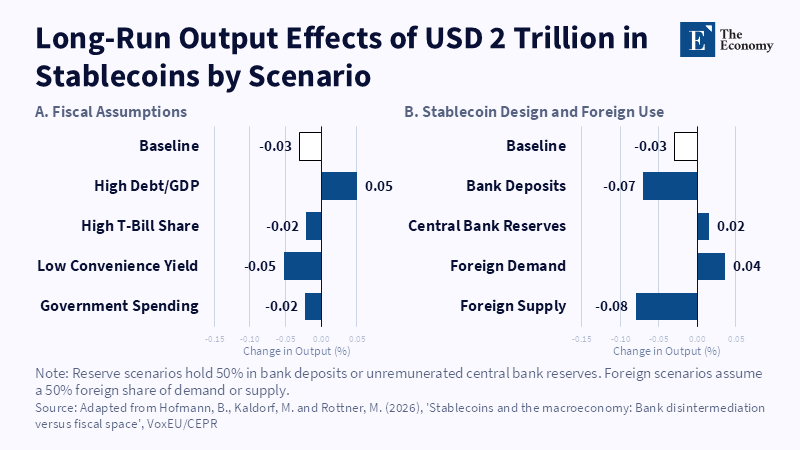
Figure: Reserve requirements, fiscal conditions and foreign adoption influence the direction and size of stablecoins’ long-run output effects. Related articles:
Read More