Policy
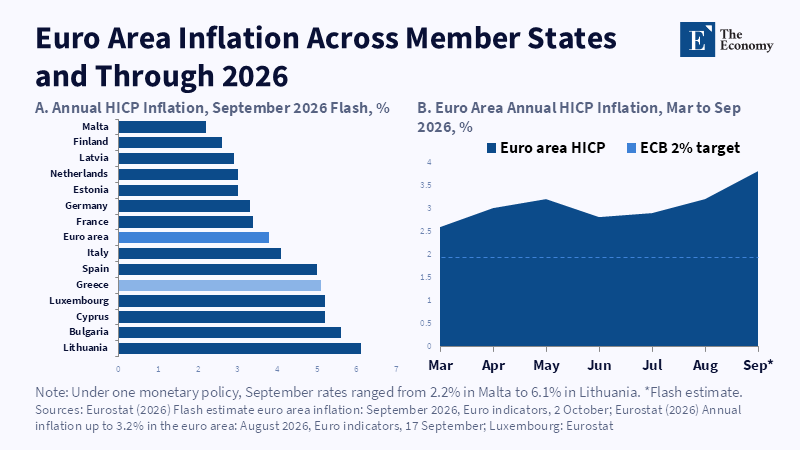
Related article: Geopolitical Shocks and Inflation: The Magnitude of the Crisis Determines the Price Path
Read More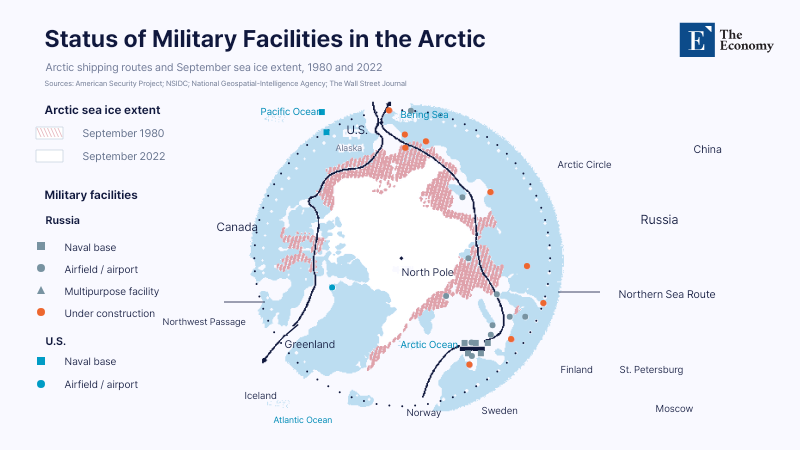
Related articles: U.S.
Read More








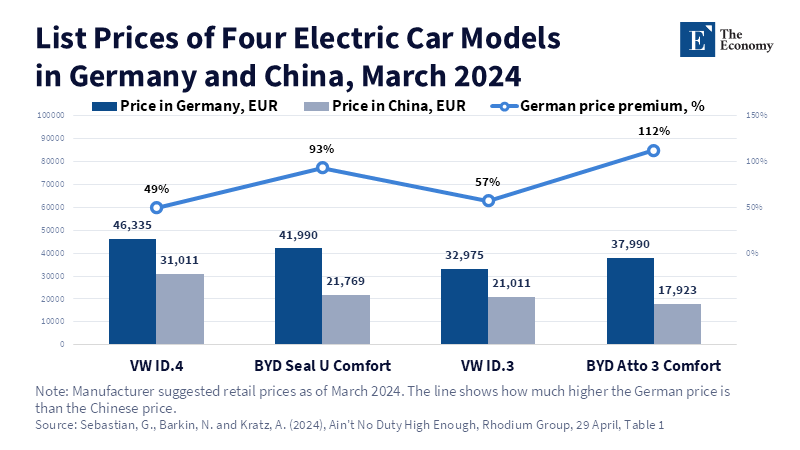
Figure 4. BYD's German prices ran 93% to 112% above its Chinese ones, nearly double Volkswagen's premium.
Read More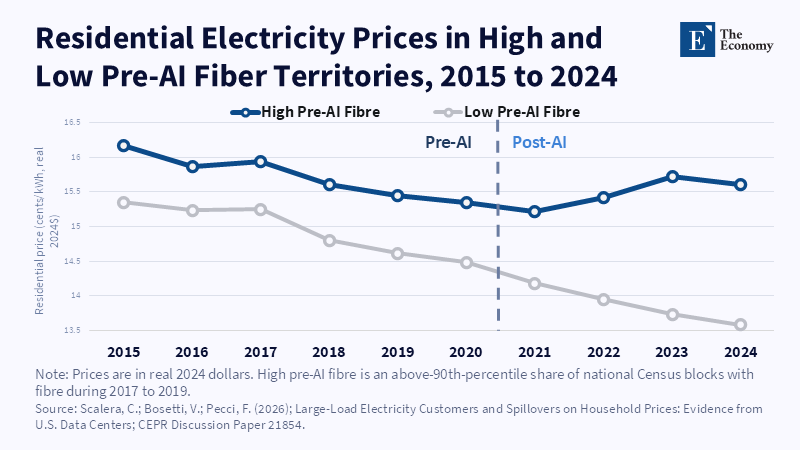
Figure 2: After 2021, high-fiber prices rebound to about 15.6 cents while low-fiber prices keep falling. Related article:
Read More
Related article: Minimum Wage Effects: The Hidden Costs Inside Firms
Read More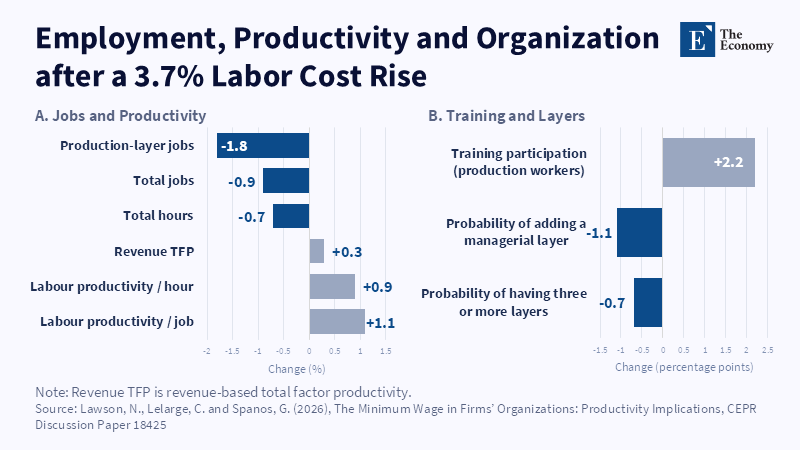
Related article: Minimum Wage Effects: The Hidden Costs Inside Firms
Read More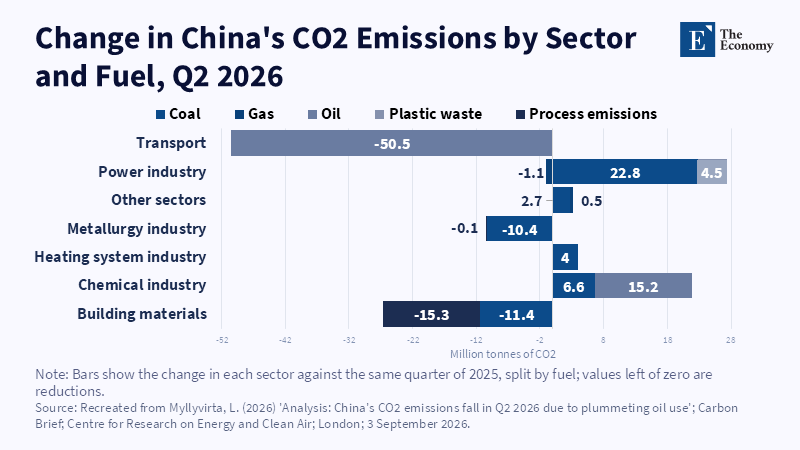
Related article: China and Fossilflation: How Renewables and Coal Kept Rates Still
Read More
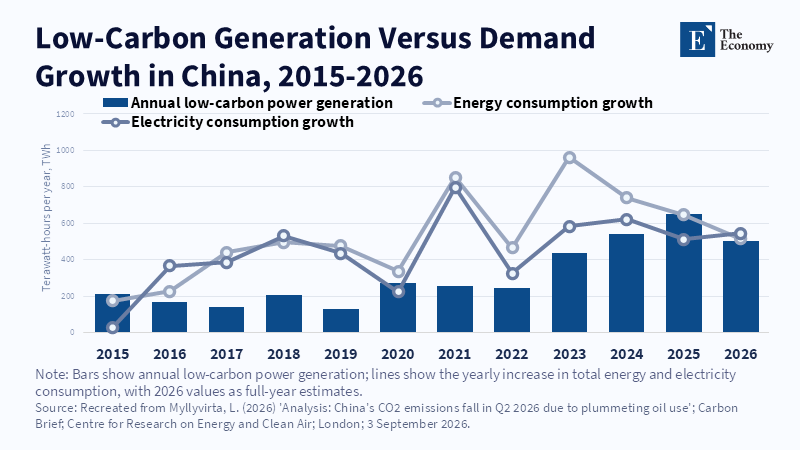
Figure 2: Low-carbon generation now nearly matches yearly growth in power demand. Related article: China and
Read More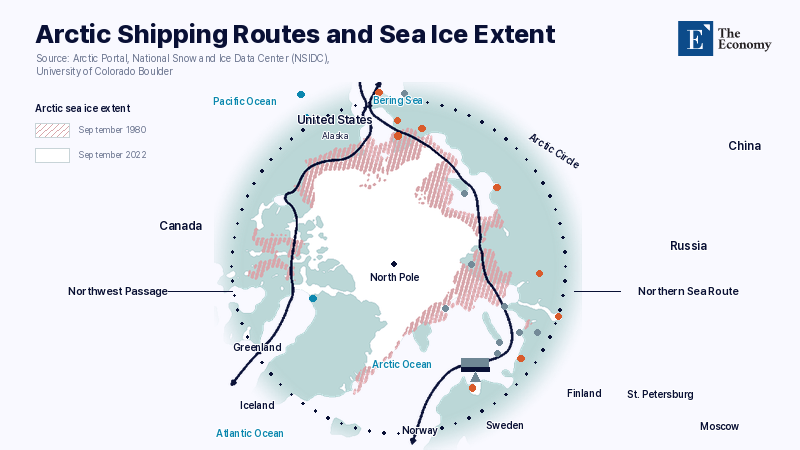
Related Articles: “Divided by Tariffs, United in the Arctic”: China-Russia Alignment Draws North America Together as U.S. and Canada Drill to Accelerate Bering Sea Interceptions | News — The Economy
Read More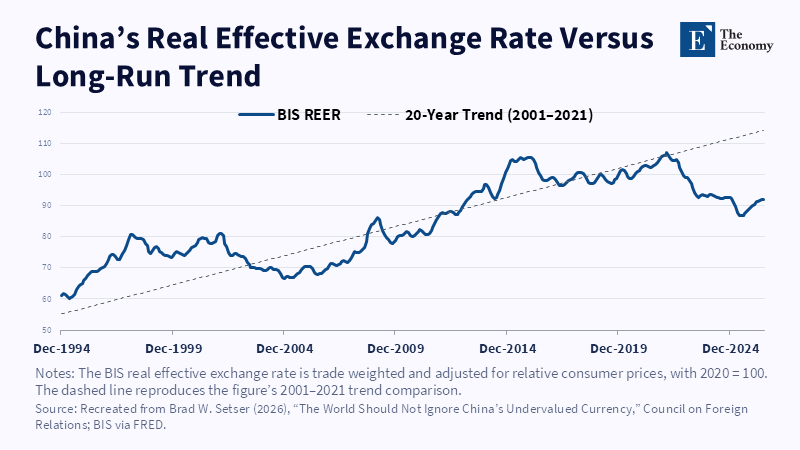
Figure 1: China’s real exchange rate remains well below its long-run trend. Related article:
Read More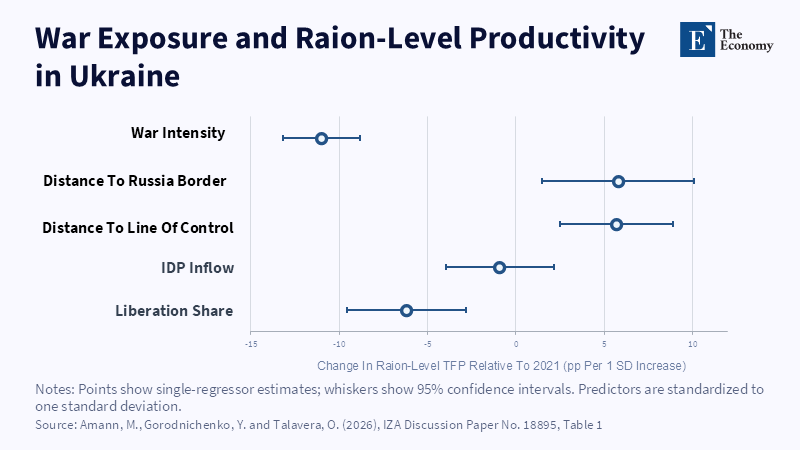
Figure 2: Local productivity losses track attack intensity more than distance. Related article:
Read More
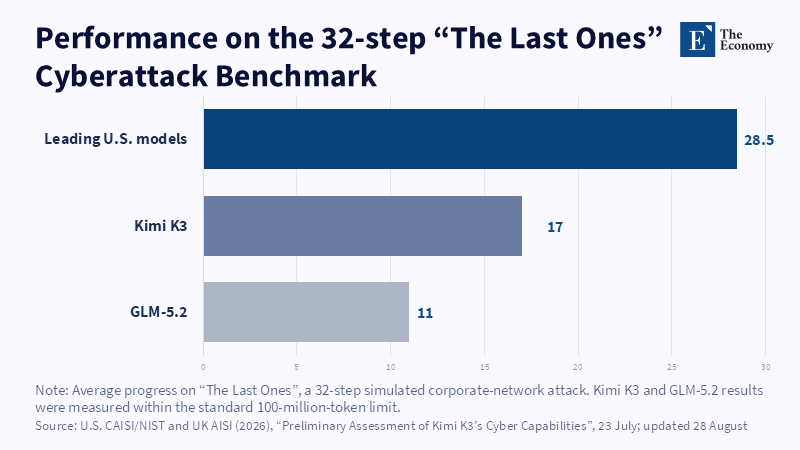
Figure 1: On a 32-step simulated attack, Kimi K3 completed barely six of every ten steps the leading US models did. Related article:
Read More