Policy
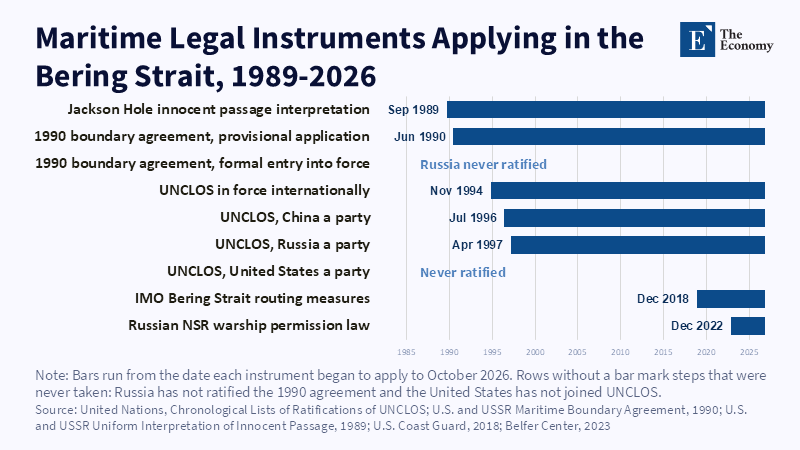
Figure: The boundary Russia never ratified has applied longer than UNCLOS has bound Russia or China. Related articles: [Arctic Maritime St
Read More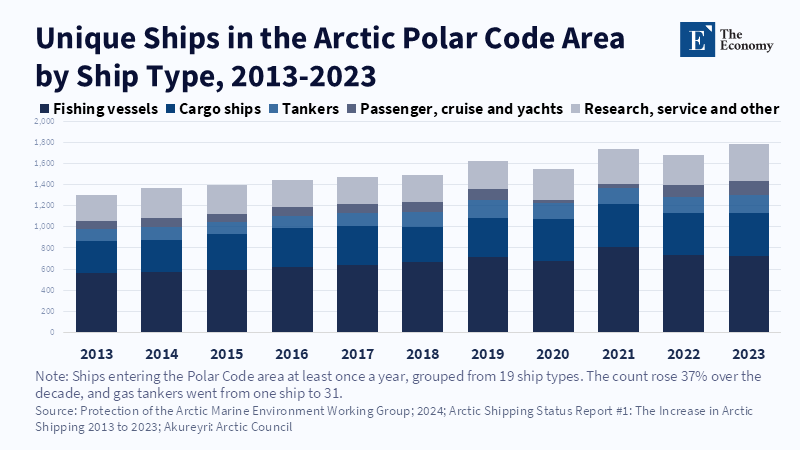
Figure: Arctic traffic rose 37 percent in a decade, which is why the 2018 routes matter. Related articles: [Arctic Maritime Strategy] Sover
Read More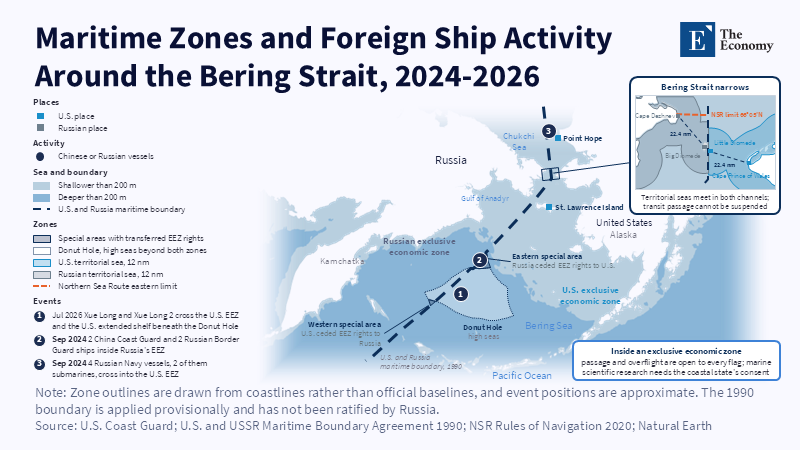
Figure: All three encounters happened in economic zones, where passage is lawful. Related articles: [Arctic Maritime Strategy] Sovereignty,
Read More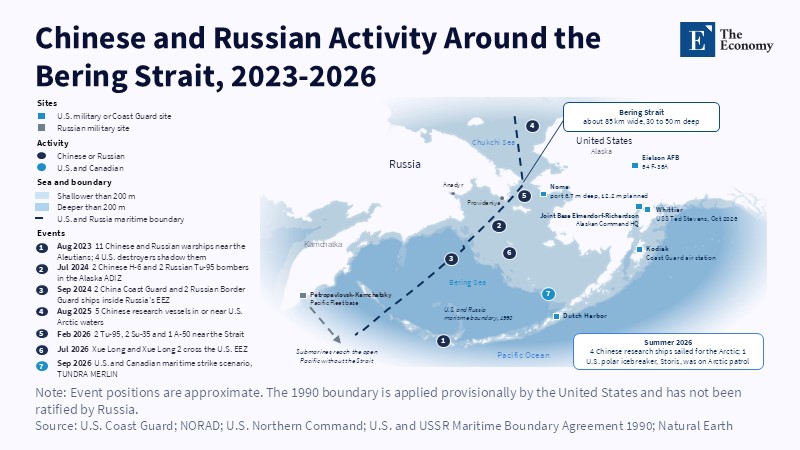
Figure: Most Chinese and Russian activity stays near the 1990 boundary, while Russia’s Pacific submarines reach the ocean without using the Strait. Related articles:
Read More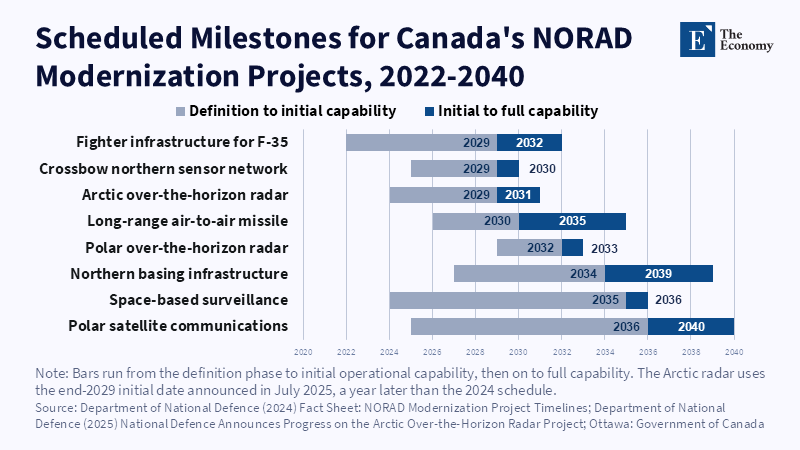
Figure: Canada brings radars and satellites first, and its maritime capability mostly arrives after 2030. Related articles: [Arctic M
Read More







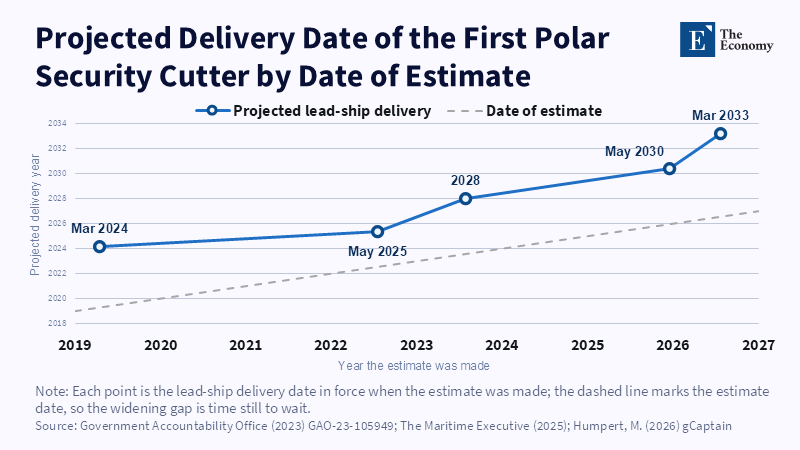
Figure: Each new estimate pushed delivery further out, so seven years after the contract the wait is longer than at the start. Related articles:
Read More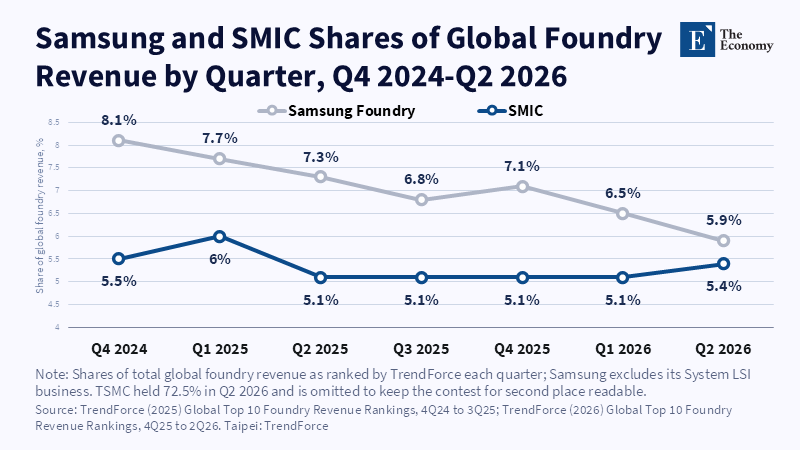
Figure: In six quarters, the gap between the second- and third-largest foundries shrank from 2.6 to 0.5 points. Related articles: Why the Sem
Read More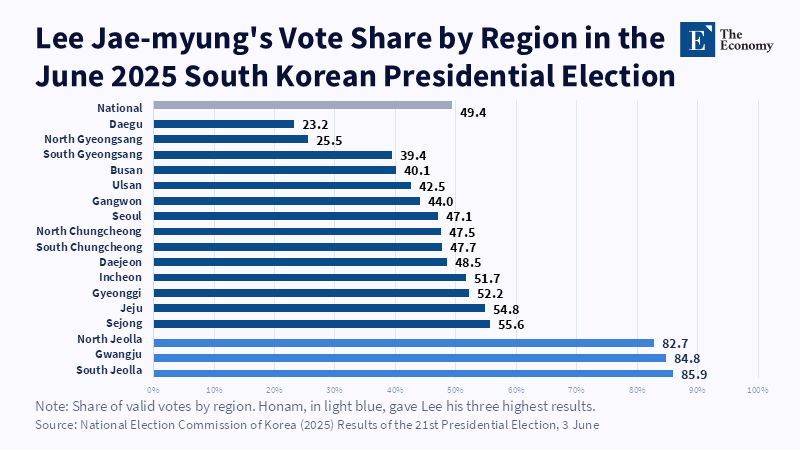
Figure: The 800 trillion won cluster is planned for the three regions that gave Lee his highest vote shares. Related articles: Why the Semic
Read More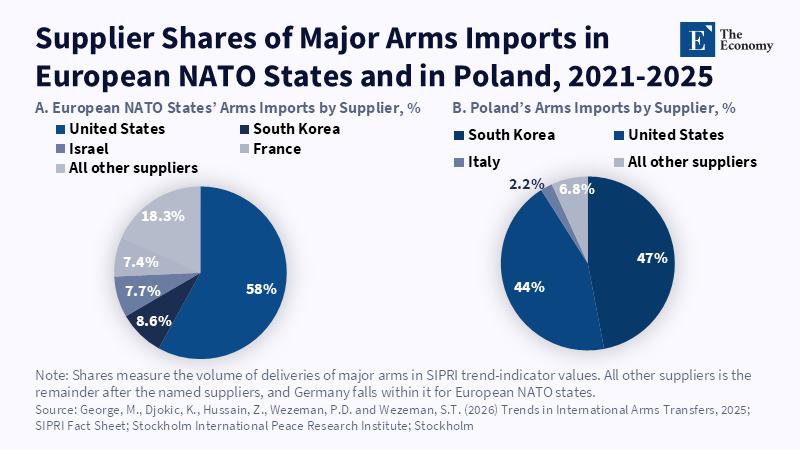
Figure: Poland, the bloc’s largest arms importer, now buys more from Seoul than from Washington. Related articles: How ‘Buy
Read More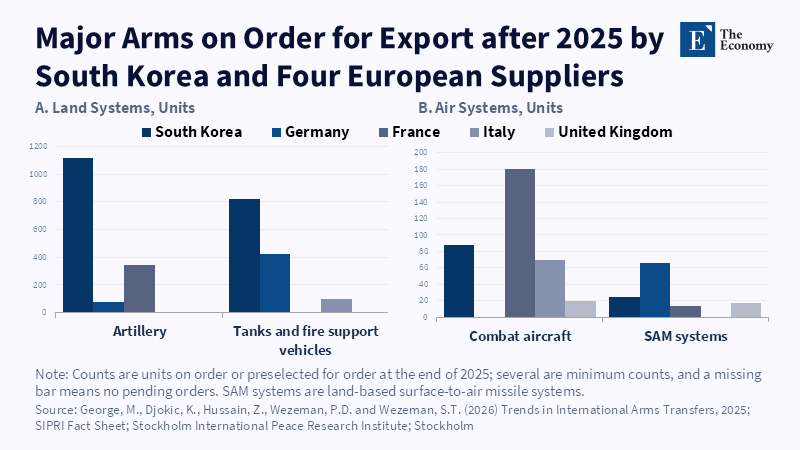
Figure: Korea’s land-systems order book exceeds four European suppliers combined, while Europe keeps the lead in the air. Related articles:
Read More
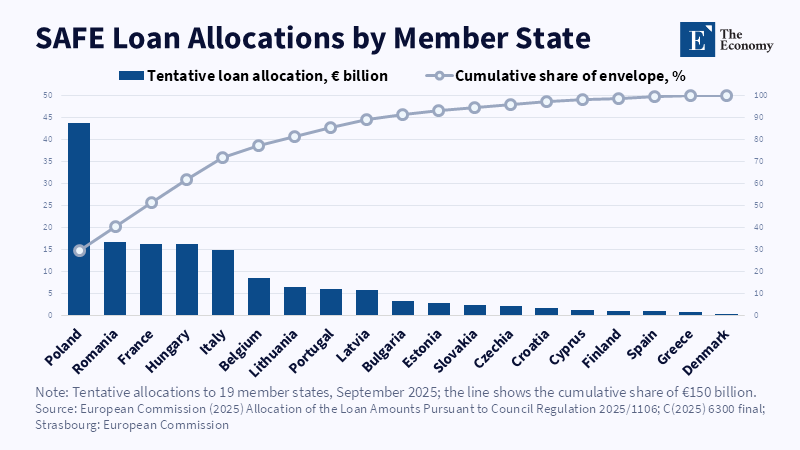
Figure: Poland alone holds 29.2% of SAFE loans, so the largest pool of EU defence credit sits with Korea’s biggest customer, not with Japan’s GCAP partners. Related articles:
Read More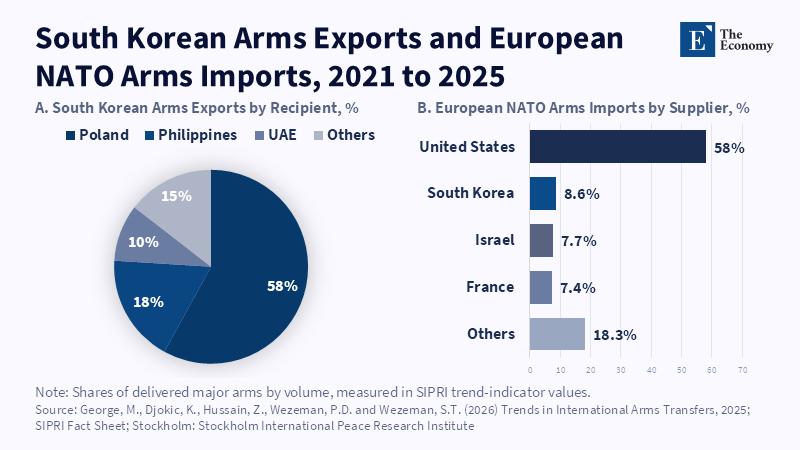
Figure: Korea’s 8.6% share of European NATO arms imports rests largely on one buyer, Poland, which takes 58% of all Korean arms exports. Related articles:
Read More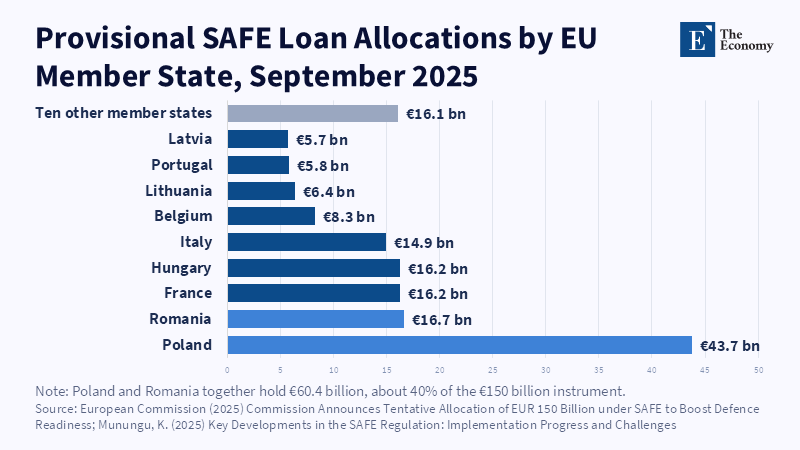
Figure: The two largest Korean customers in the EU also hold the two largest SAFE loans. Related articles: South Korean Defense Groups Shift
Read More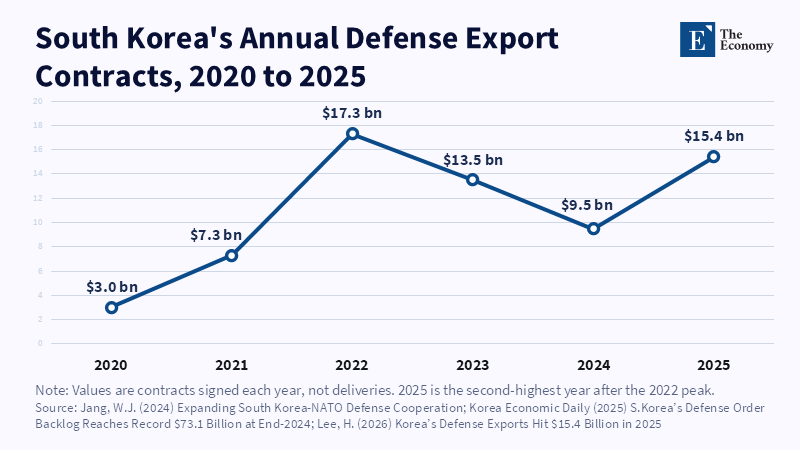
Figure: Korean orders swing sharply from year to year, and new European plants need steady ones. Related articles: South Korean Defense Grou
Read More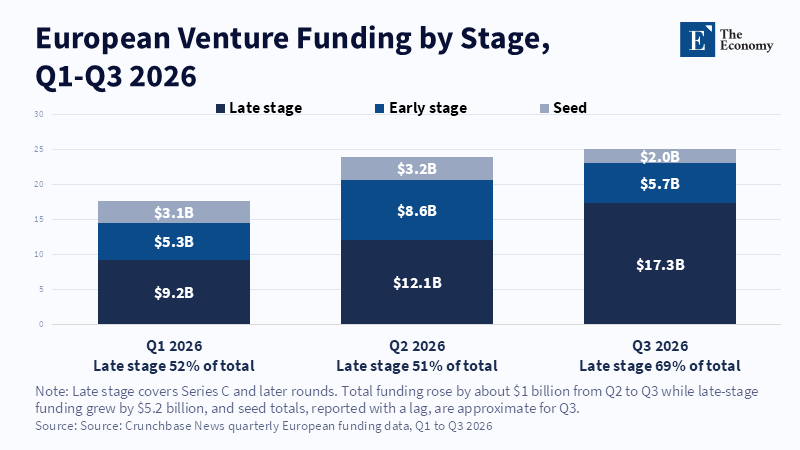
Figure: The total barely moved in Q3, while late-stage capital jumped to $17.3 billion, about 70% of funding. Related articles: Europe’s Tech
Read More
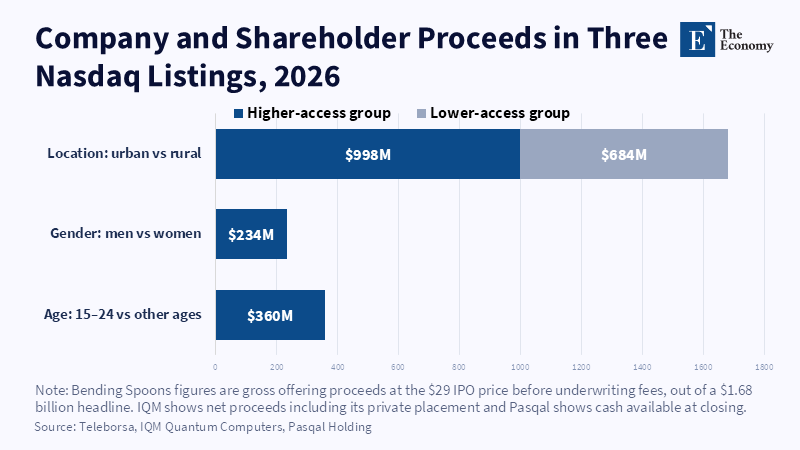
Figure: About $684 million of Bending Spoons’ $1.68 billion headline went to selling shareholders, not the company. Related articles: Europe
Read More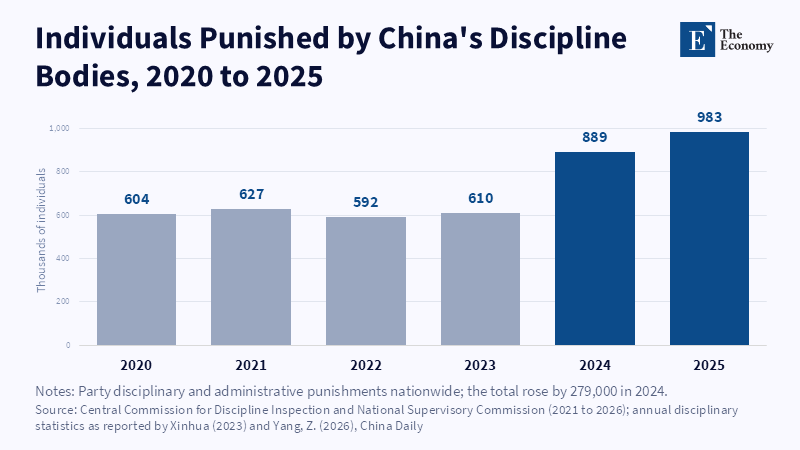
Figure: Punishments held near 600,000 for four years, then jumped 46 percent in 2024, the same year Beijing reopened channels to Hong Kong. Related articles:
Read More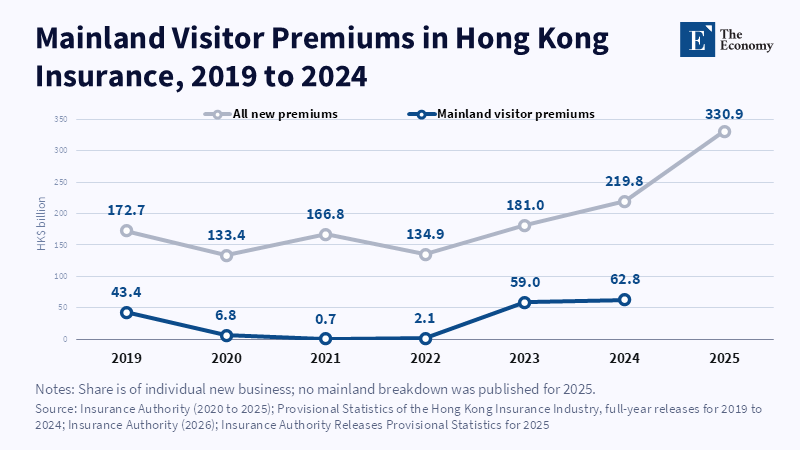
Figure 1: Mainland buyers came back to a third of new sales once the border reopened.
Read More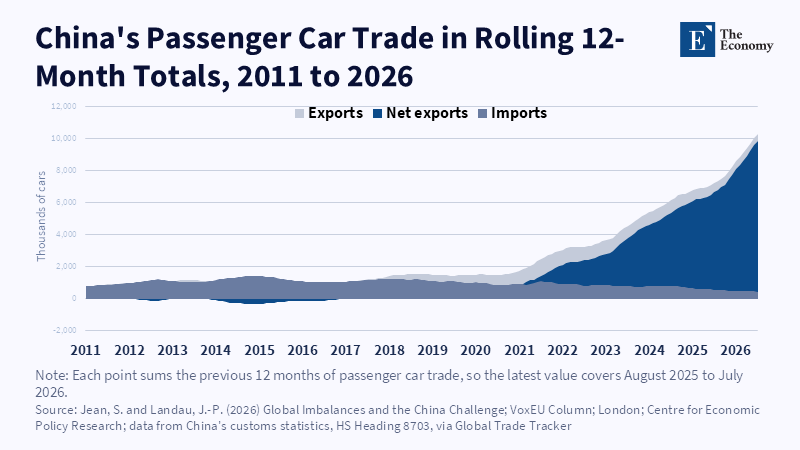
Figure: China imported more cars than it exported until 2017.
Read More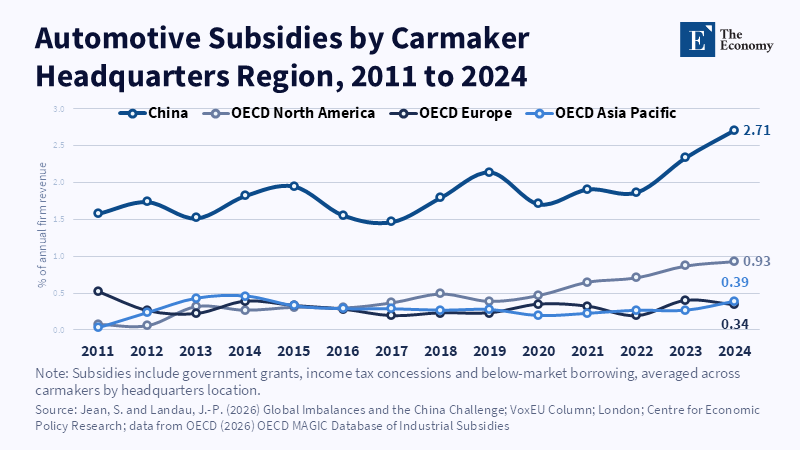
Figure: Chinese carmakers received subsidies worth 2.7 percent of revenue in 2024, nearly three times the North American rate and about seven times Europe’s. Related articles:
Read More