Policy
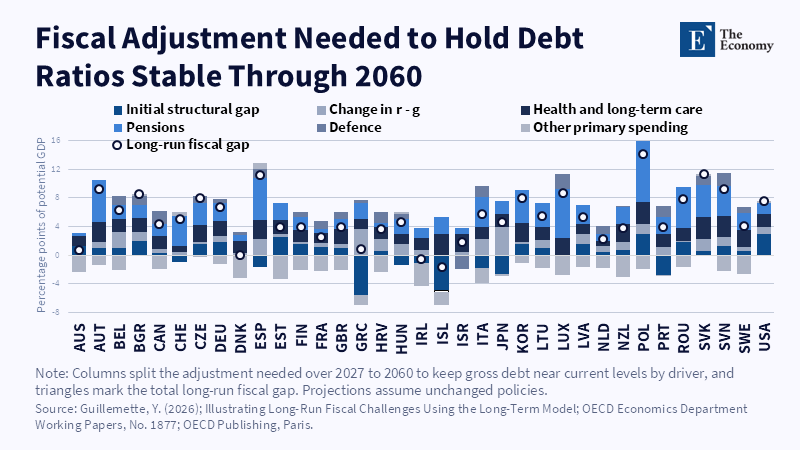
Figure: Pensions and health care, not interest costs, drive most national fiscal gaps. Related articles: The Fiscal Conversion Gap: Why AI-Led Gro
Read More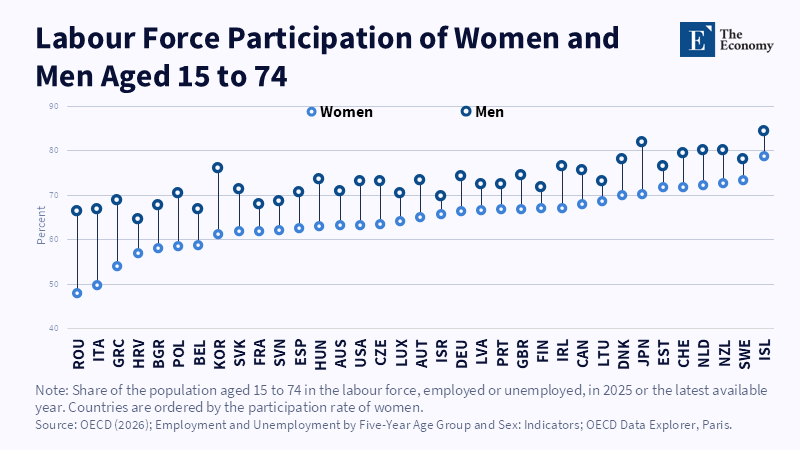
Figure: Low participation among women shows where employment-led growth could still cut deficits. Related articles: The Fiscal Conversion Gap: Wh
Read More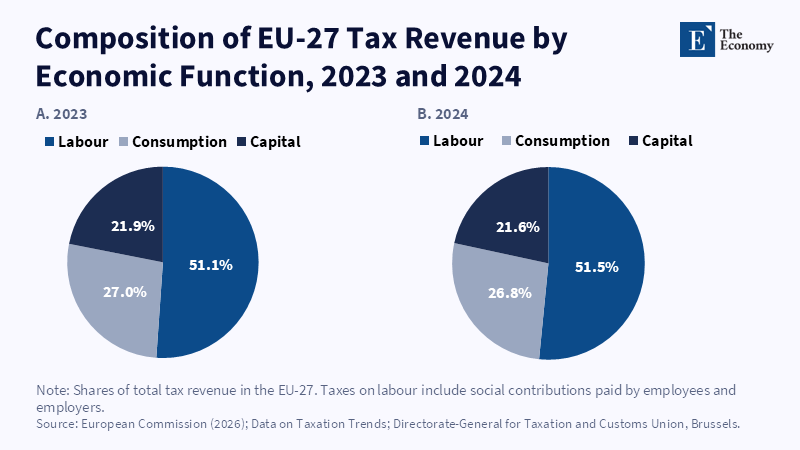
Figure: Labour still supplies over half of EU tax revenue, and its share is rising. Related articles: The Fiscal Conversion Gap: Why AI-Led Grow
Read More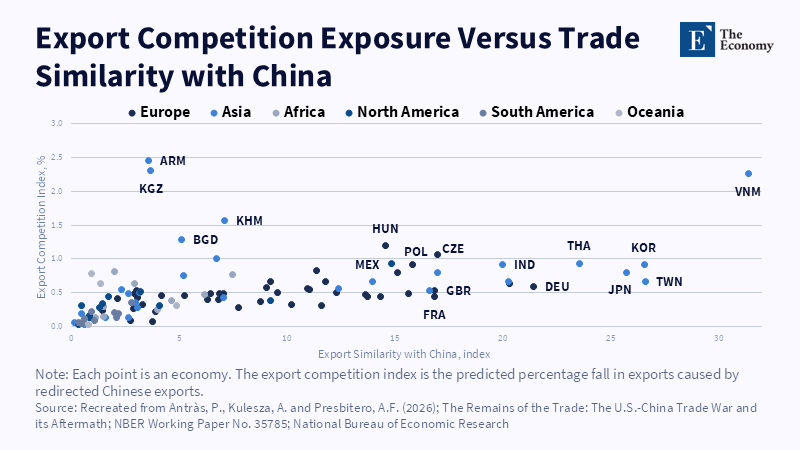
Figure: Germany’s exports closely resemble China’s, yet several smaller Asian economies face far more competition from redirected Chinese goods. Related articles:
Read More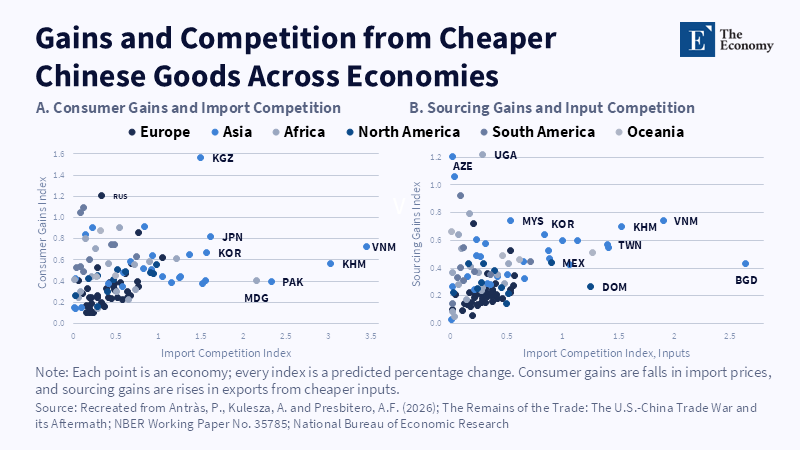
Figure: The economies most exposed to Chinese competition often gain the most from cheaper Chinese goods and inputs. Related articles: U.S.-China
Read More







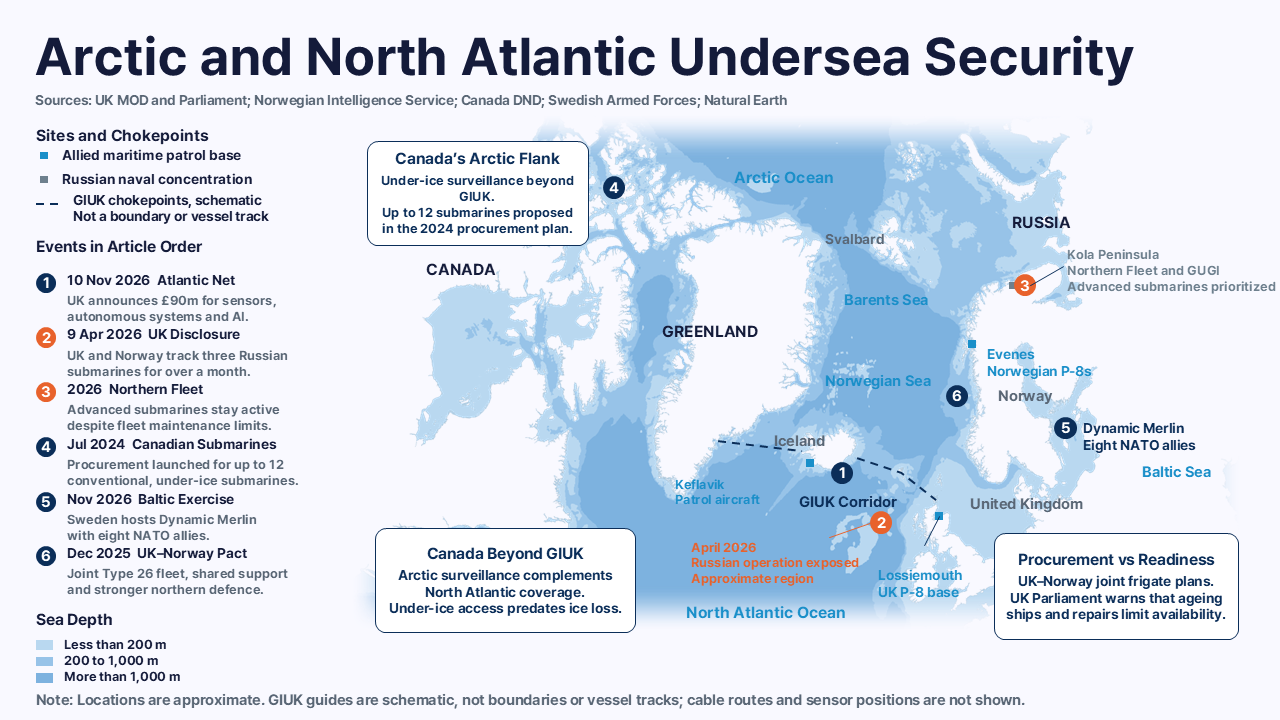
Note: The map shows Russian Northern Fleet submarine bases and key surveillance and response activities by the UK, Nordic countries and Canada.
Read More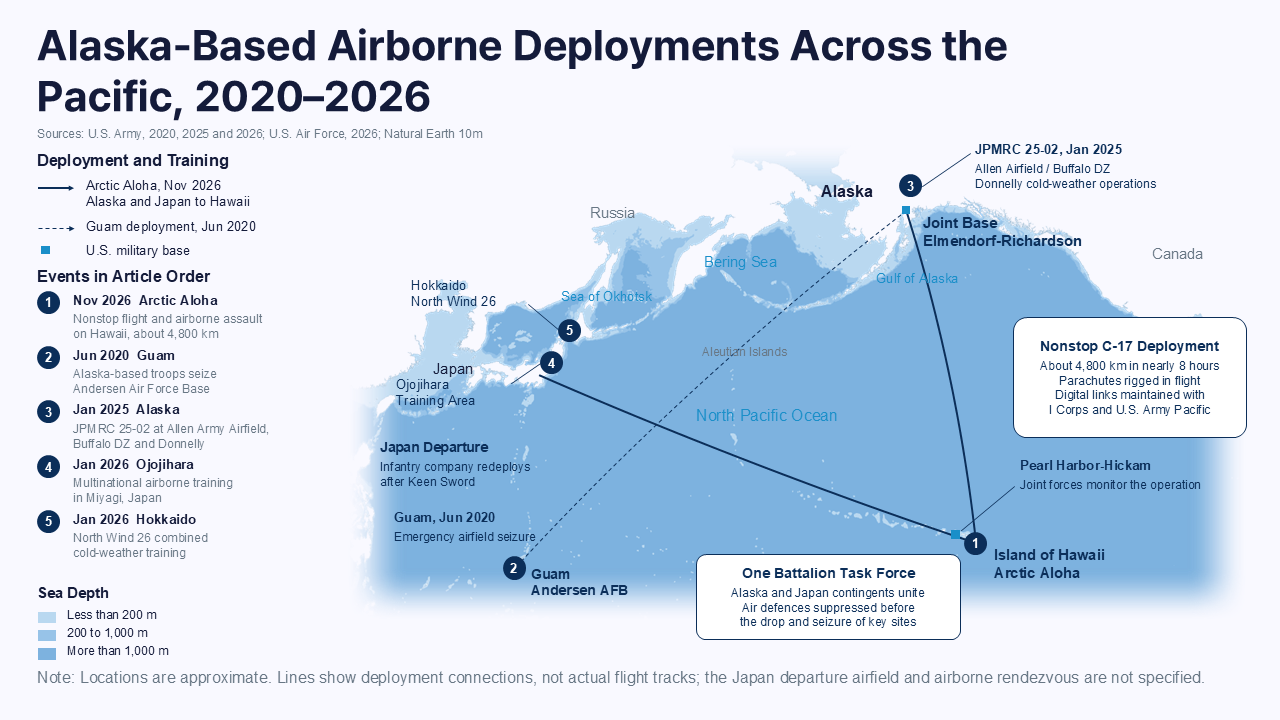
Related articles: Flying 4,800 km, parachuting in and heading straight into battle: Alaska-based U.S.
Read More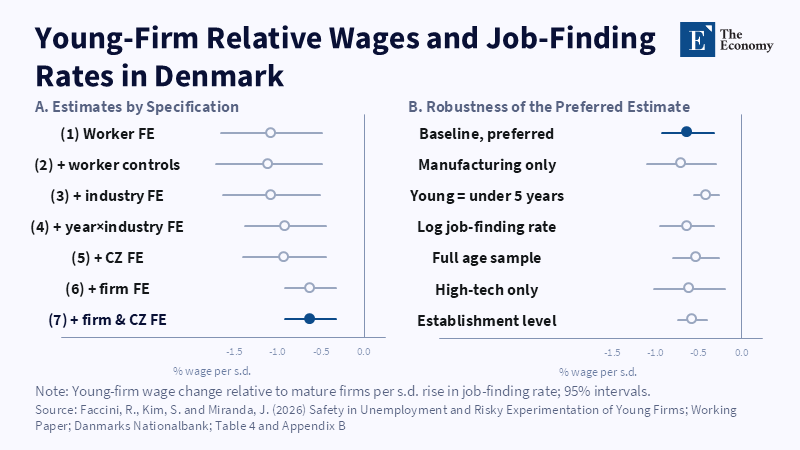
Figure: In every specification, young firms pay less relative to mature firms where jobs are easier to find. Related articles: Europe's Innova
Read More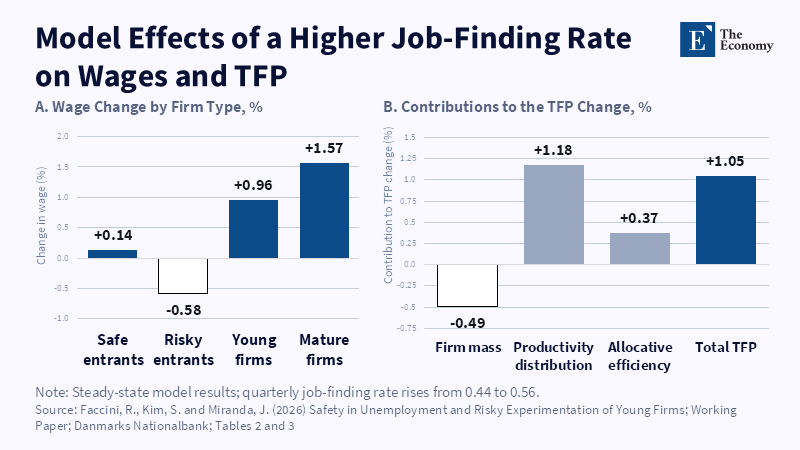
Figure: Faster re-employment cuts pay at risky entrants and lifts aggregate productivity by about 1% in the model. Related articles: Europe's
Read More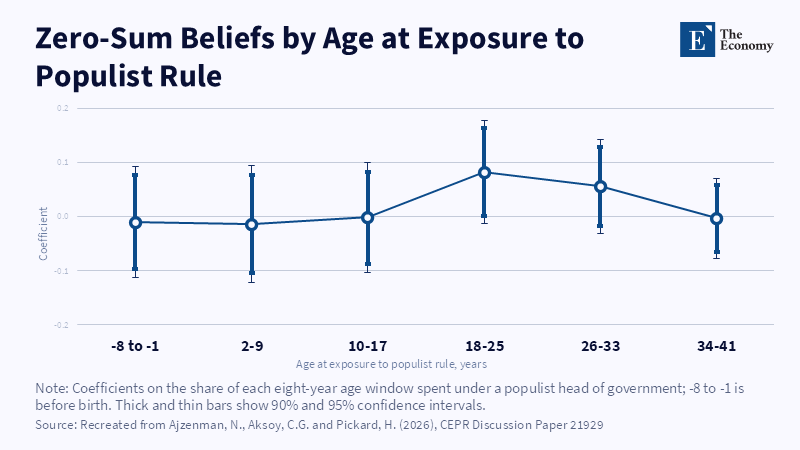
Figure: Populist rule raises zero-sum beliefs only when experienced between ages 18 and 25. Related articles: Populism's Zero-Sum Legacy:
Read More
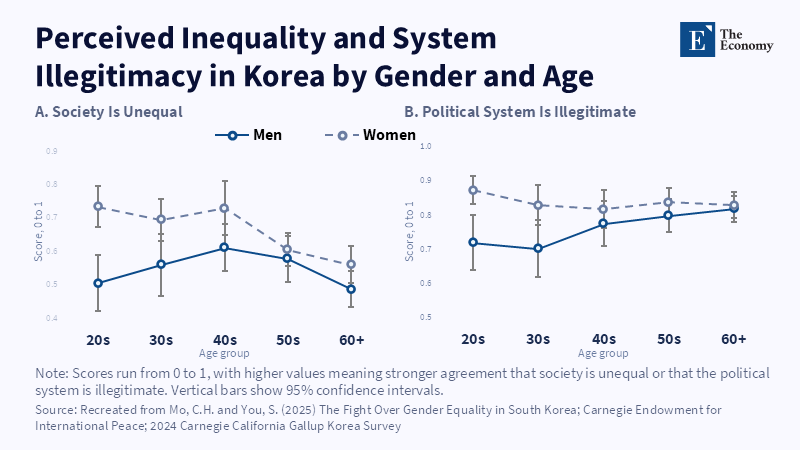
Figure: Young Korean women see the most inequality; young men among the least. Related articles: Populism's Zero-Sum Legacy: Political R
Read More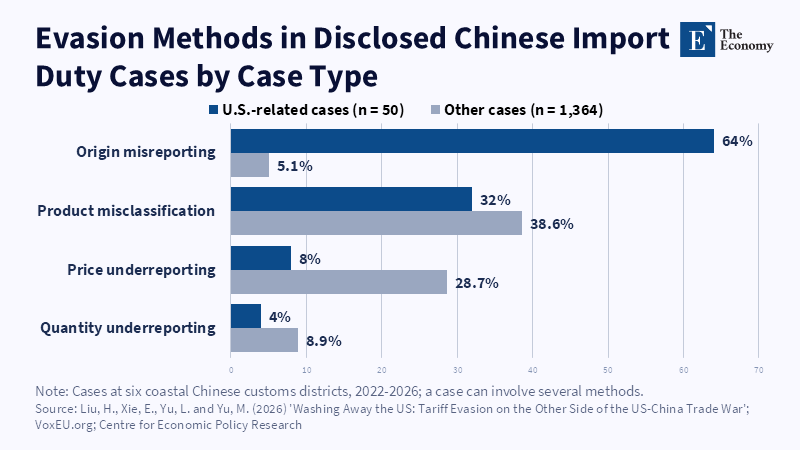
Figure: Faked origin dominates once a tariff singles out one country. Related articles: Tariff Evasion and the Hidden Welfare Cost
Read More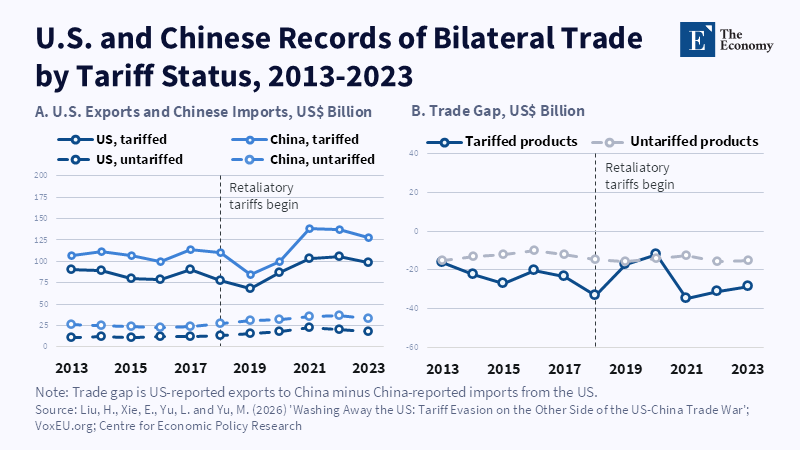
Figure: Only tariffed goods opened a gap between the two countries’ records. Related articles: Tariff Evasion and the Hidden Welf
Read More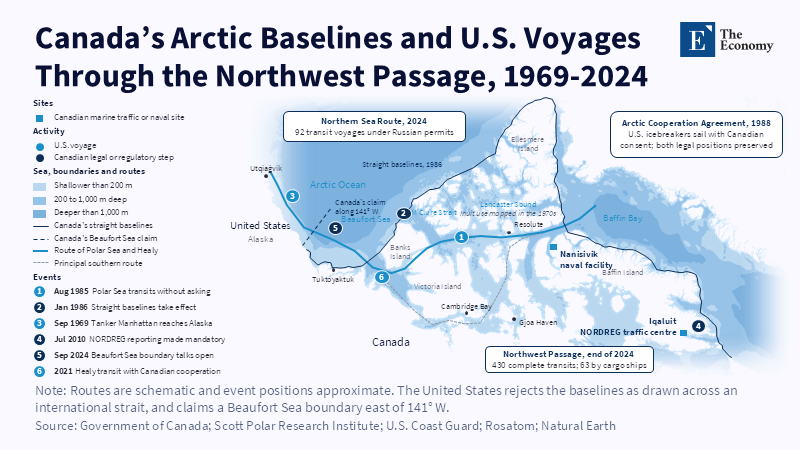
Figure: Canada’s baselines close both ends of the passage, so every U.S.
Read More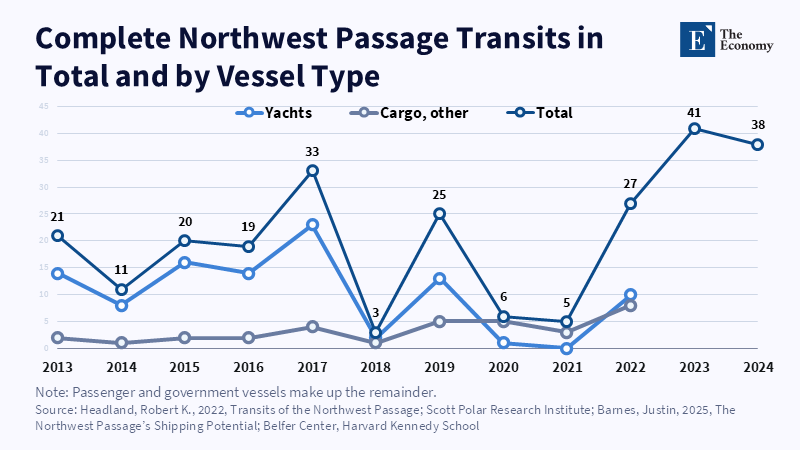
Figure: Yachts make up most transits, and cargo ships rarely exceed a handful a season.
Read More
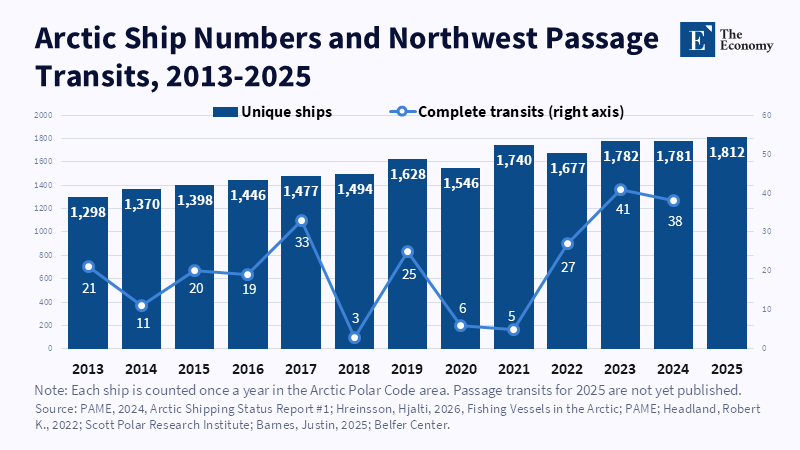
Figure: Arctic shipping grew 40 percent in twelve years, yet passage transits swung between 3 and 41 with ice and Canadian rules. Related articles:
Read More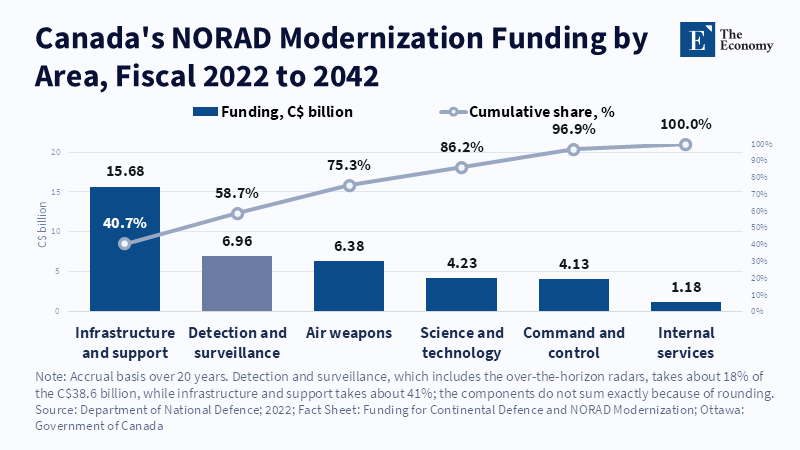
Figure: Only about 18% of the C$38.6 billion goes to detection and surveillance. Related articles: [Arctic Maritime Strategy] Canada’s Northwes
Read More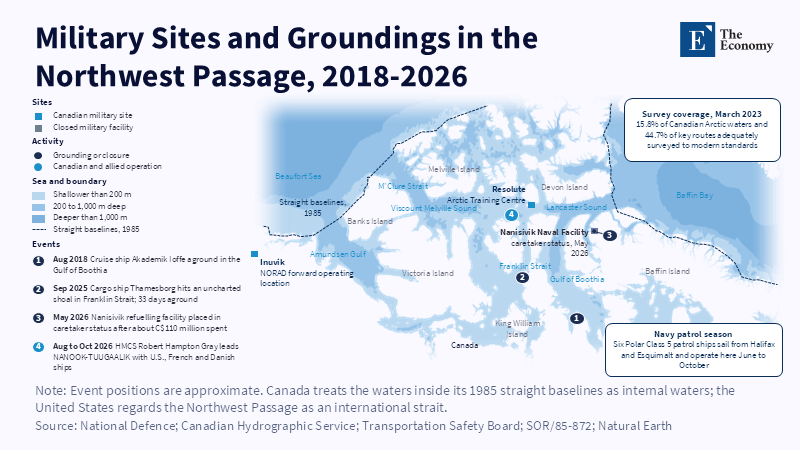
Figure: The baselines enclose the whole Archipelago, yet the only northern naval facility is closed. Related articles: [Arctic Maritime Strategy]
Read More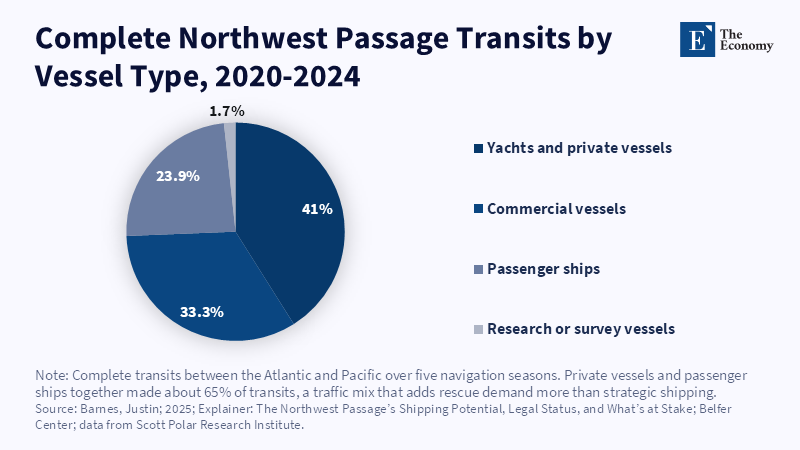
Figure: Most transits are private and passenger vessels, which adds rescue demand. Related articles: [Arctic Maritime Strategy] Canada’s Northwe
Read More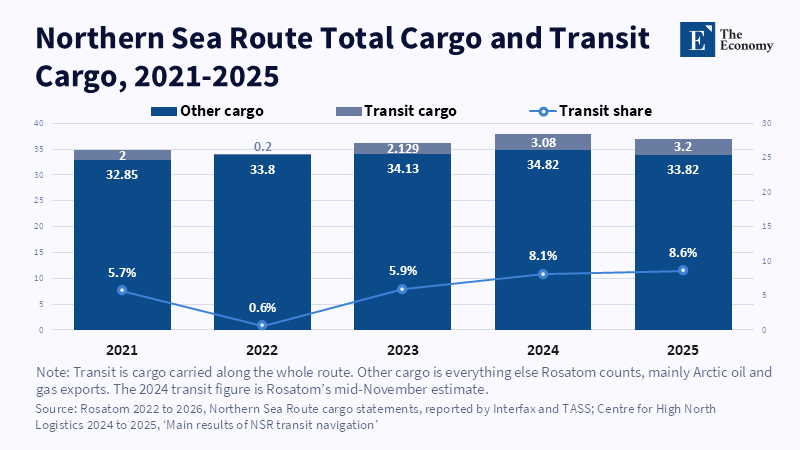
Figure: Transit hit a record 3.2 Mt in 2025, still under one tonne in eleven. Related articles: [Arctic Maritime Strat
Read More