Industry
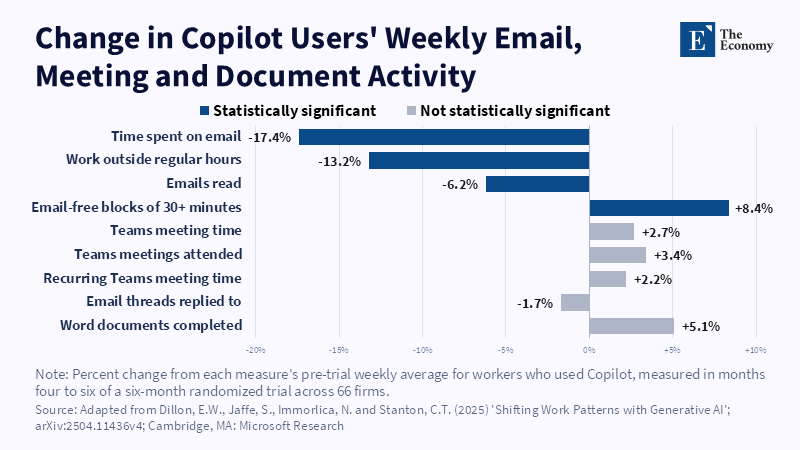
Figure: Users cut email time by 17%, while meeting time and meeting counts held steady. Related articles: Do AI Note-Takers Cu
Read More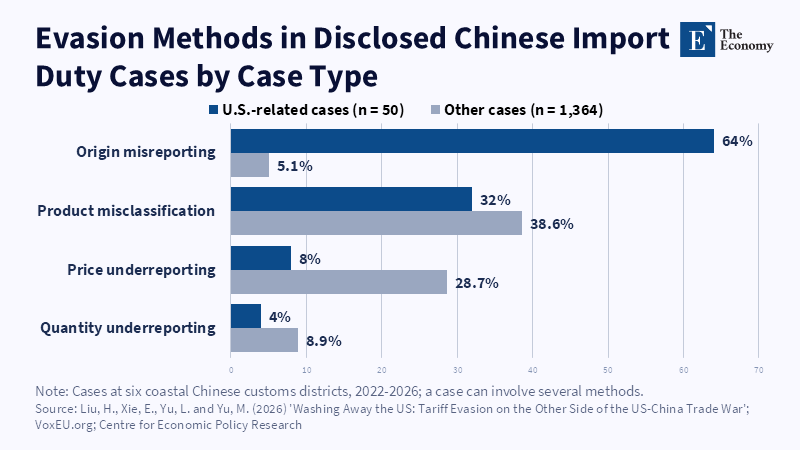
Figure: Faked origin dominates once a tariff singles out one country. Related articles: Tariff Evasion and the Hidden Welfare Cost
Read More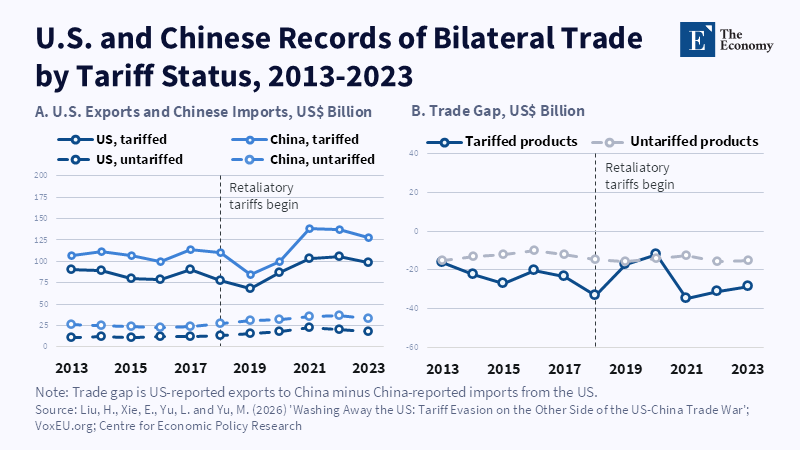
Figure: Only tariffed goods opened a gap between the two countries’ records. Related articles: Tariff Evasion and the Hidden Welf
Read More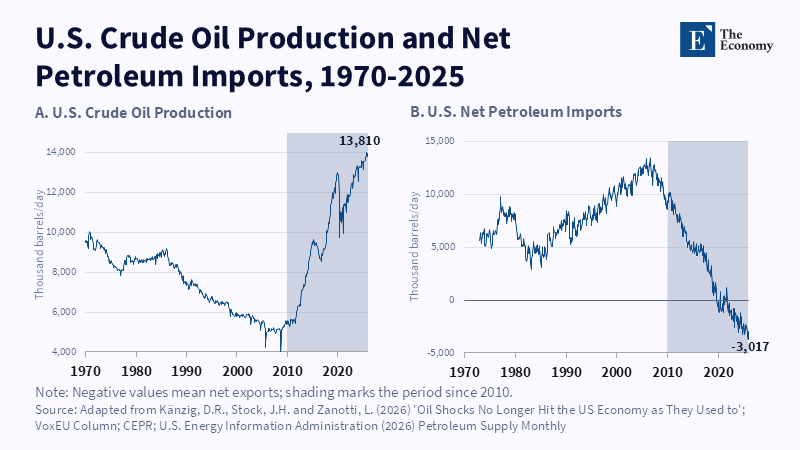
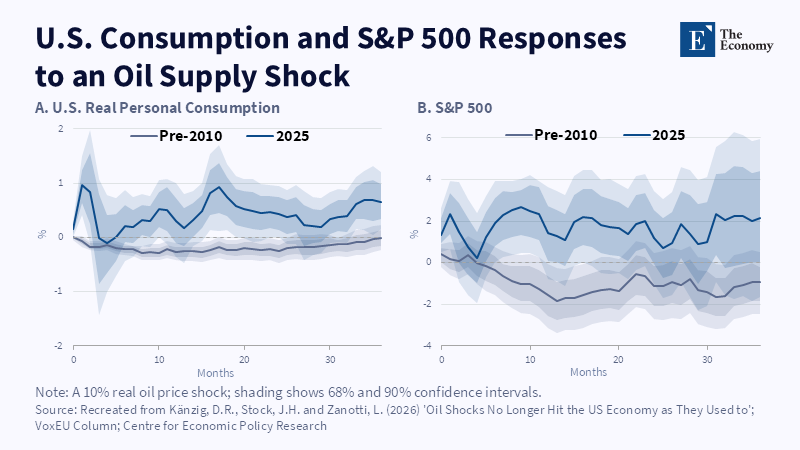
Figure: At the 2025 trade position, consumption and share prices rise after an oil supply shock instead of falling. Related articles: Oil Pr
Read More







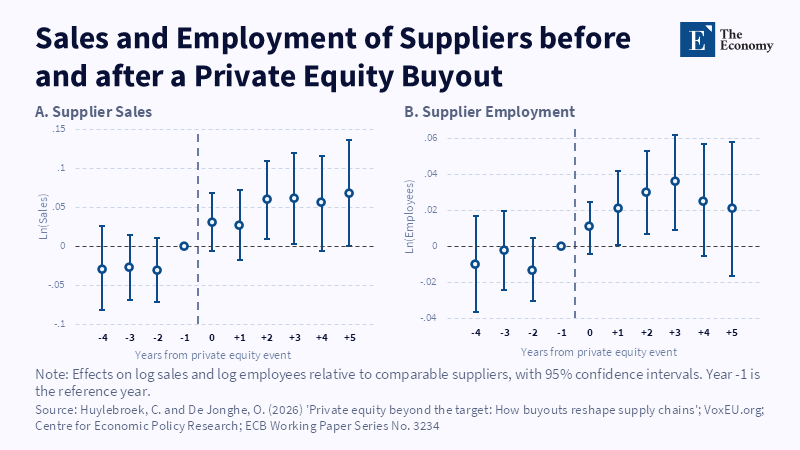
Figure: Suppliers show no gap before the buyout and pull ahead after it, more in sales than in jobs. Related articles: Merger Revi
Read More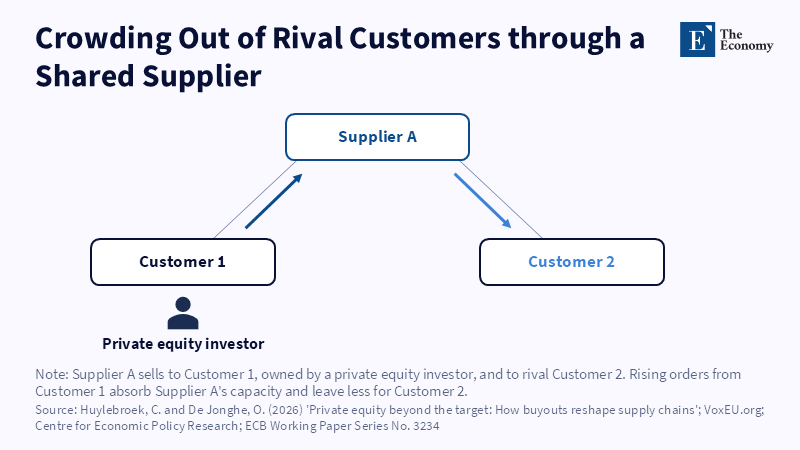
Figure: A rival can lose a supplier’s capacity without being part of the deal. Related articles: Merger Review Misses the Supply
Read More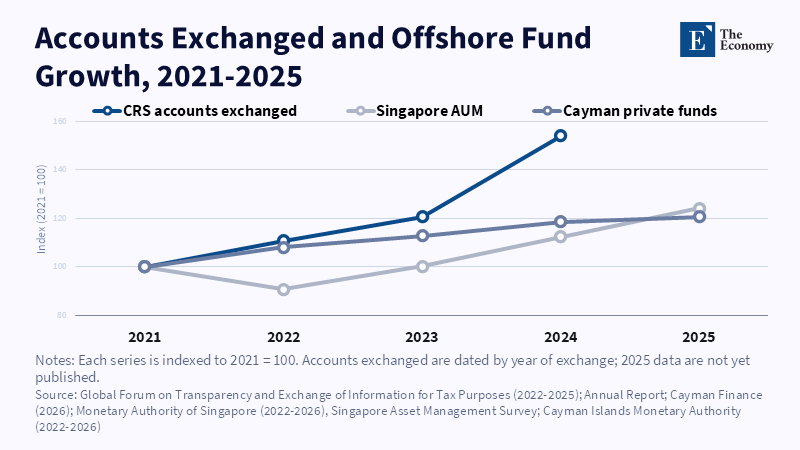
Figure: Accounts reported to tax authorities rose 54% between 2021 and 2024, while Cayman private funds grew 21% and Singapore’s managed assets 24% by 2025. Related articles:
Read More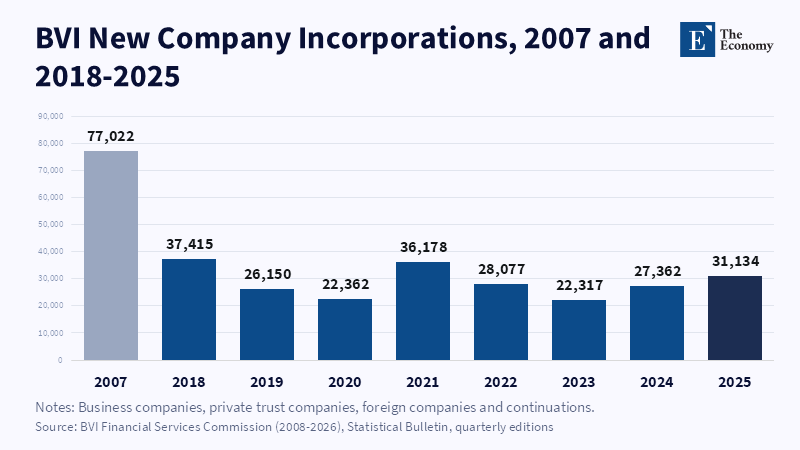
Figure: The 2025 rebound to 31,134 new companies still left BVI incorporations at 40% of their 2007 peak. Related articles: [Offshore Finance]
Read More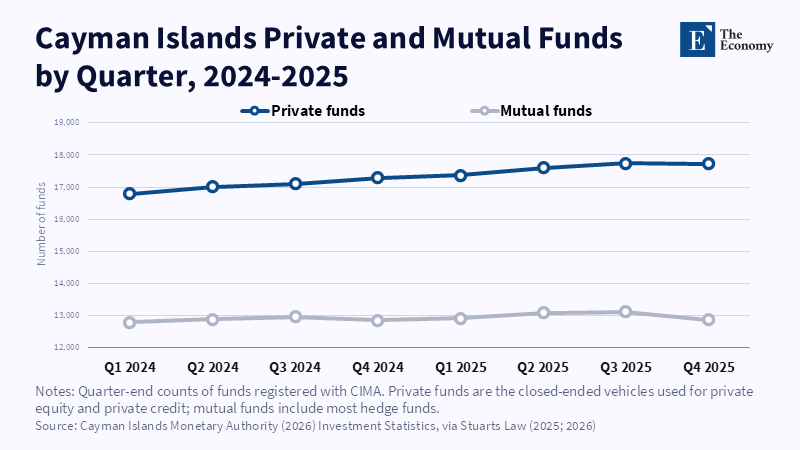
Figure: Cayman’s growth now comes from private capital.
Read More
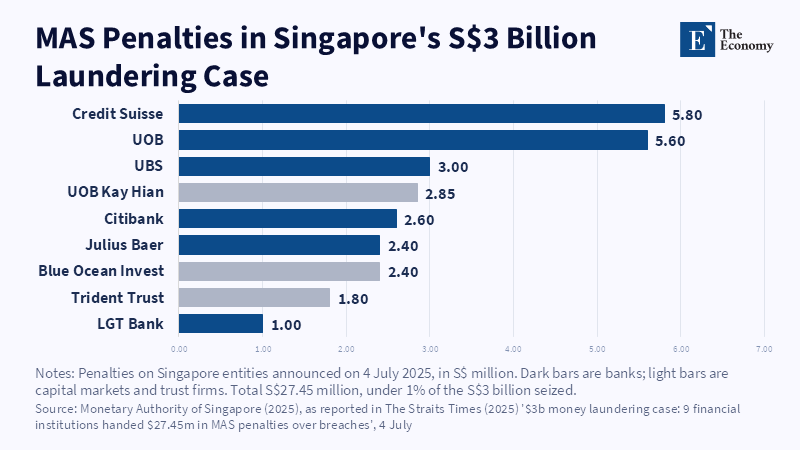
Figure: Nine institutions paid S$27.45 million between them, less than 1% of the assets seized. Related articles: [Offshore Finance] Not A
Read More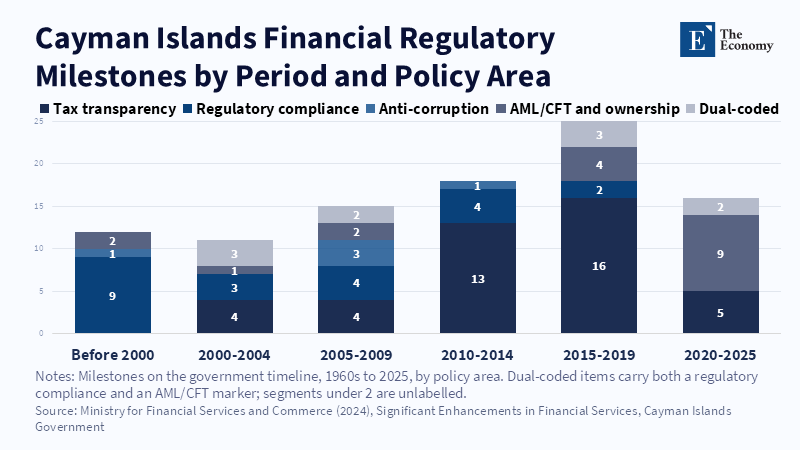
Figure: Tax transparency dominated the 2010s; after 2020 reform shifted almost entirely to anti-money laundering and beneficial ownership. Related articles:
Read More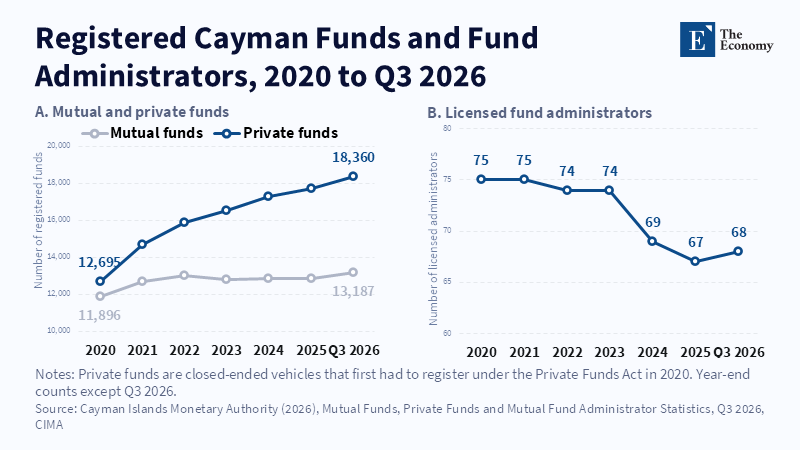
Figure: Private funds grew 45% while licensed administrators fell to 68, as compliance costs favoured larger providers. Related articles: [Offshor
Read More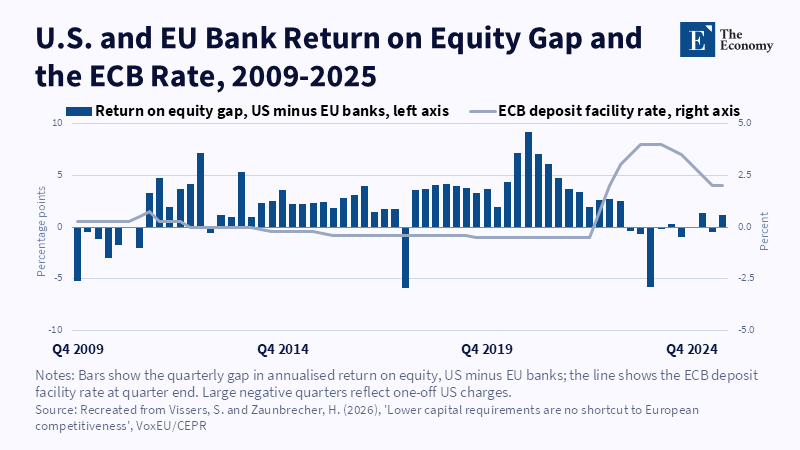
Figure: The profitability gap closed once rates rose, with no change to capital rules. Related articles: European Competitiveness: Capital Rules Built
Read More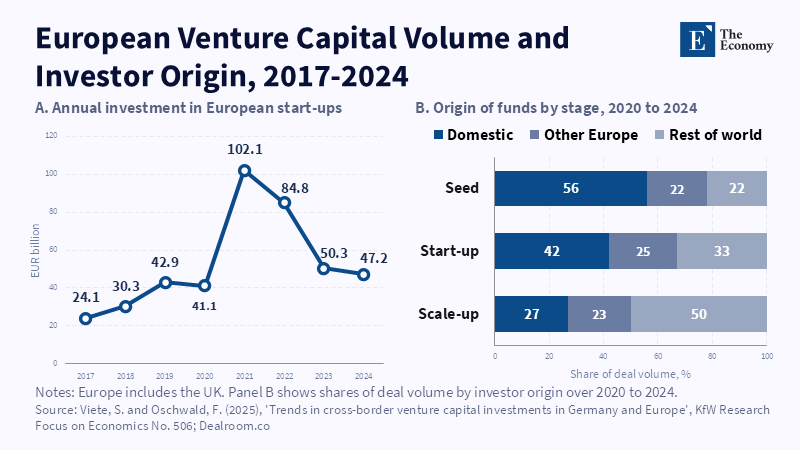
Figure: Funding halved after 2021, and scale-ups depend on capital from outside Europe. Related articles: European Competitiveness: Capital Rules Buil
Read More
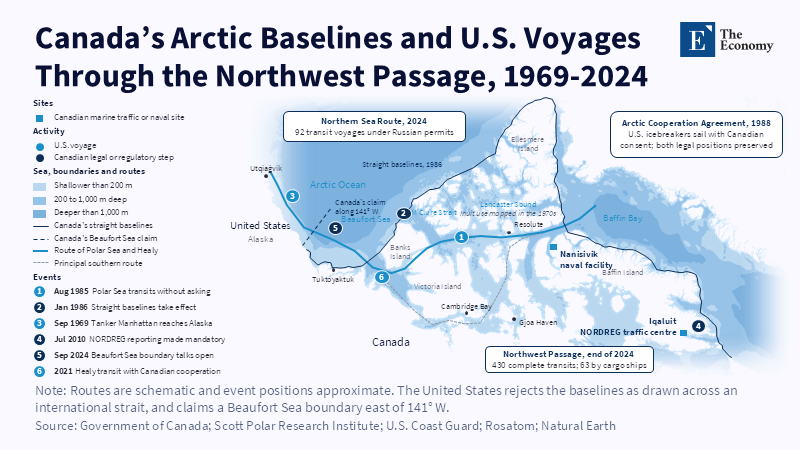
Figure: Canada’s baselines close both ends of the passage, so every U.S.
Read More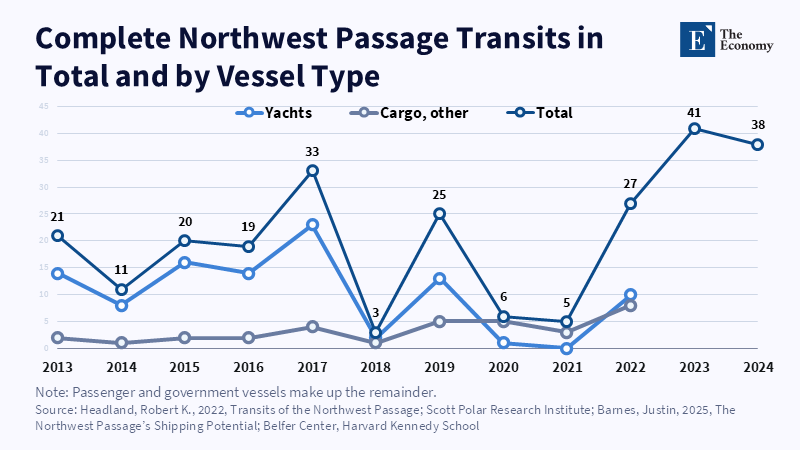
Figure: Yachts make up most transits, and cargo ships rarely exceed a handful a season.
Read More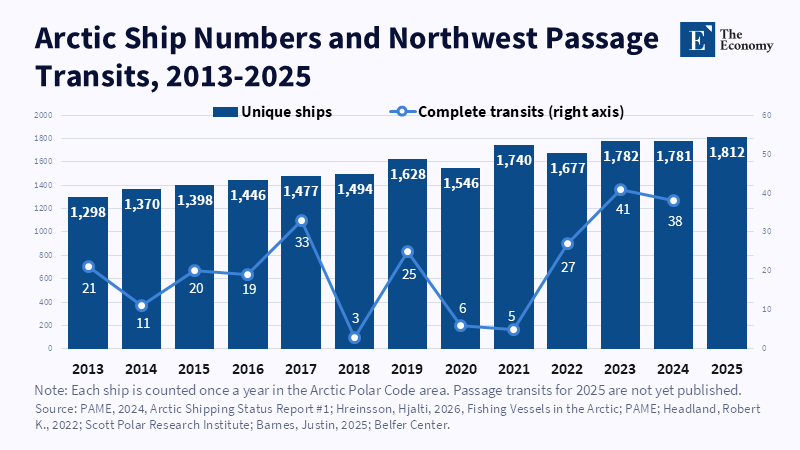
Figure: Arctic shipping grew 40 percent in twelve years, yet passage transits swung between 3 and 41 with ice and Canadian rules. Related articles:
Read More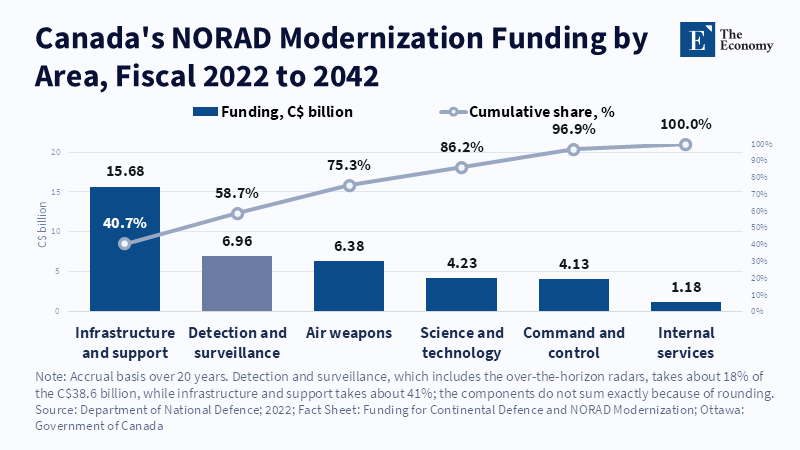
Figure: Only about 18% of the C$38.6 billion goes to detection and surveillance. Related articles: [Arctic Maritime Strategy] Canada’s Northwes
Read More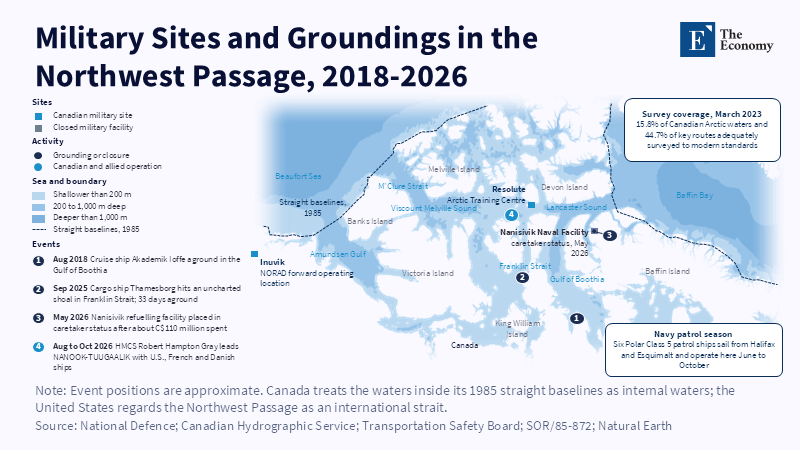
Figure: The baselines enclose the whole Archipelago, yet the only northern naval facility is closed. Related articles: [Arctic Maritime Strategy]
Read More