Industry
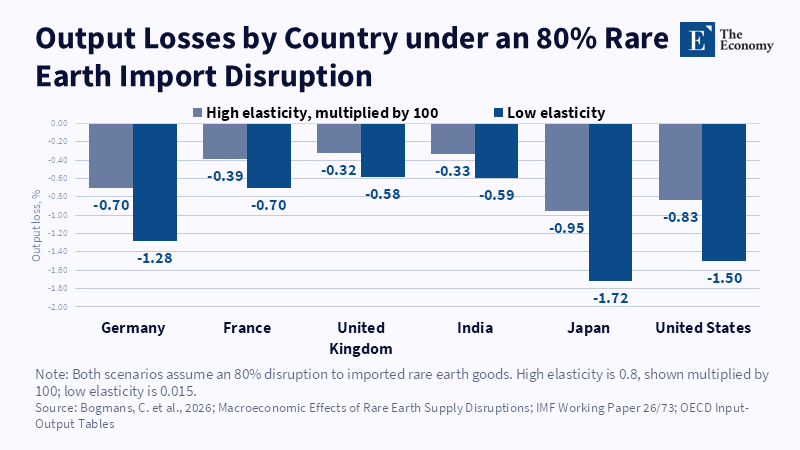
Figure: With no substitutes, Japan and the US lose the most output. Related articles: Rare Earth Supply Shocks: The Strategic Costs Beyond GDP Loss
Read More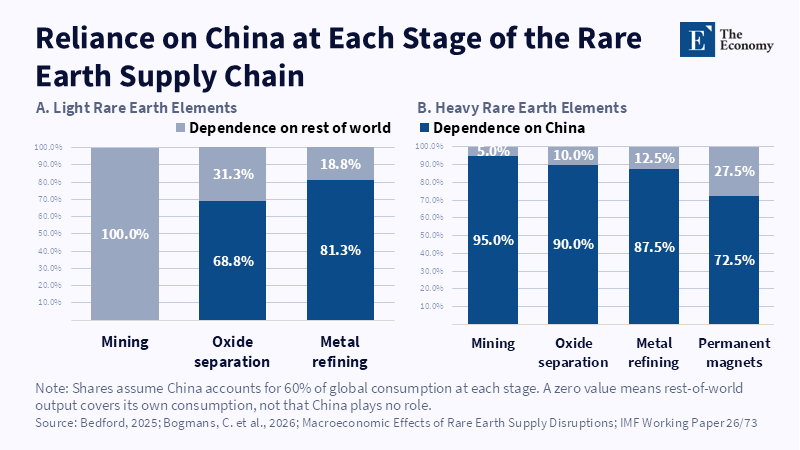
Figure: Mining outside China does little while refining stays in China Related articles: Rare Earth Supply Shocks: The Strategic Costs Beyond GDP
Read More
Figure: Losses grew far faster than complaints between 2020 and 2025. Related articles: When Seeing Is No Longer Believing: AI and th
Read More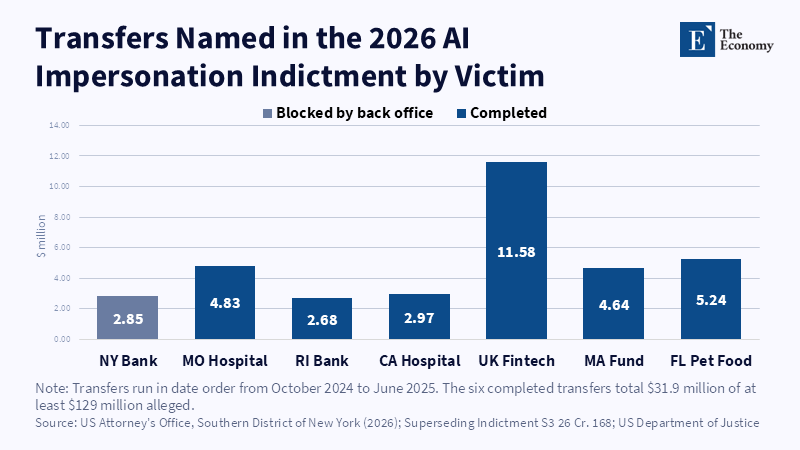
Figure: Only the investment bank’s transfer was stopped. Related articles: When Seeing Is No Longer Believing: AI and the End of Tra
Read More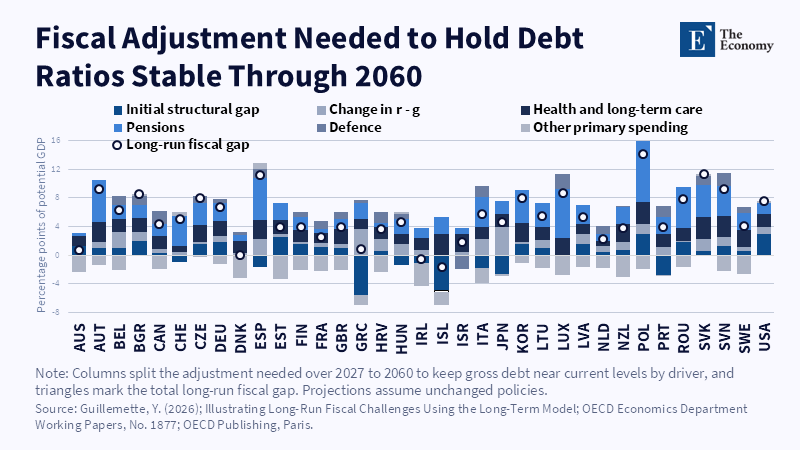
Figure: Pensions and health care, not interest costs, drive most national fiscal gaps. Related articles: The Fiscal Conversion Gap: Why AI-Led Gro
Read More







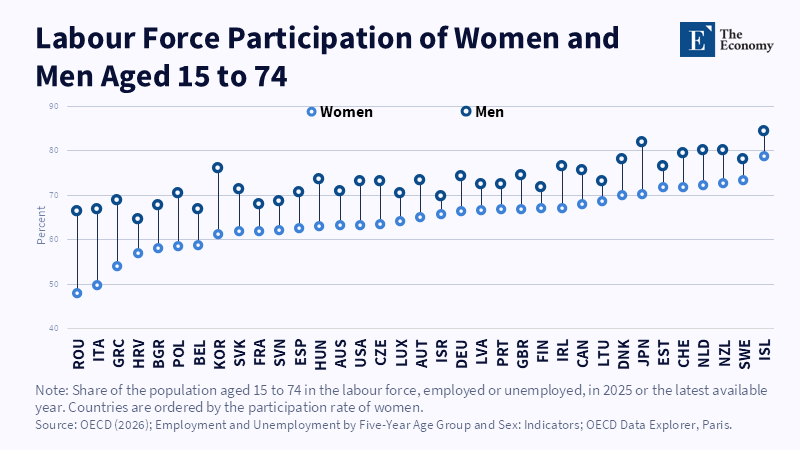
Figure: Low participation among women shows where employment-led growth could still cut deficits. Related articles: The Fiscal Conversion Gap: Wh
Read More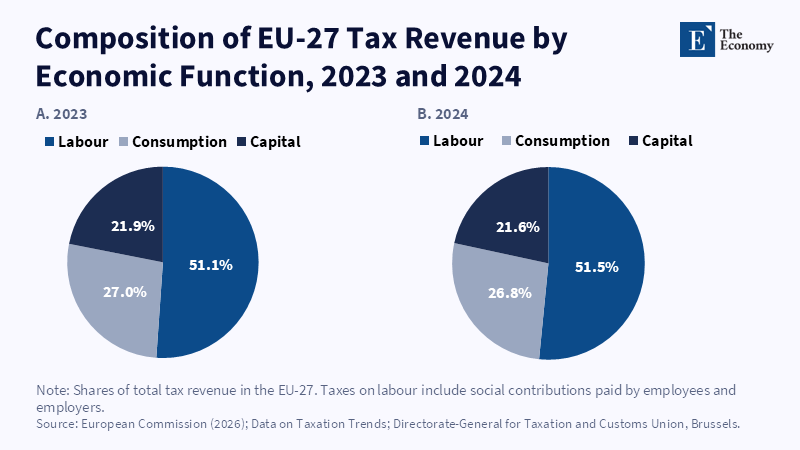
Figure: Labour still supplies over half of EU tax revenue, and its share is rising. Related articles: The Fiscal Conversion Gap: Why AI-Led Grow
Read More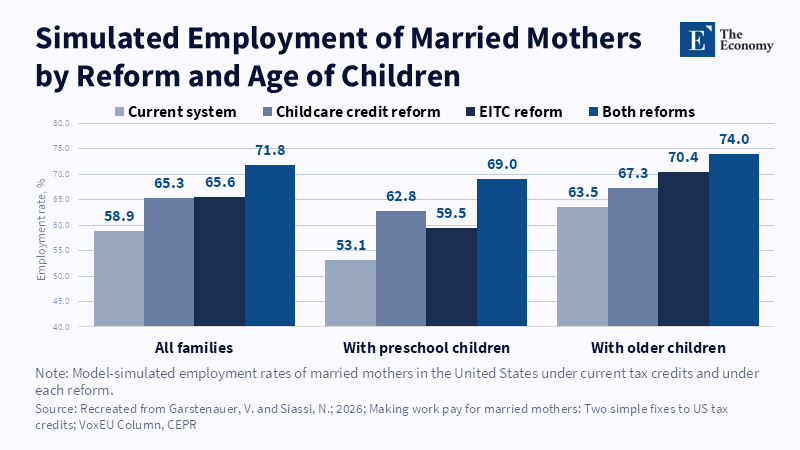
Figure: Mothers of preschool children start lowest, at 53.1% and gain more from the childcare credit reform than from the EITC change. Related articles:
Read More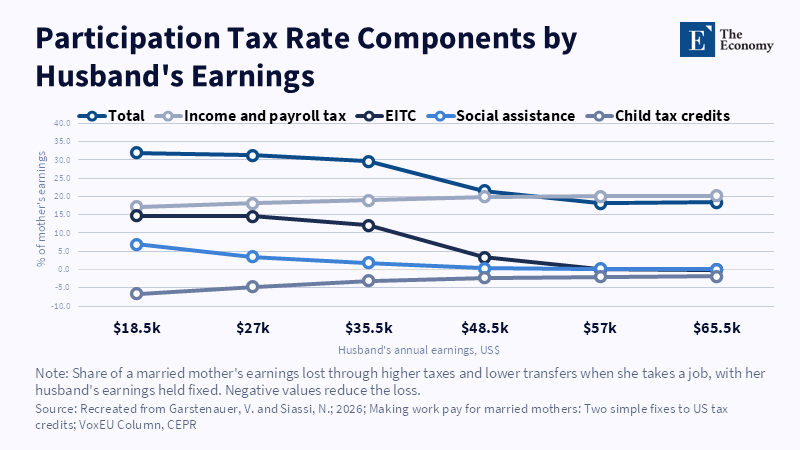
Figure: When the husband earns $18,500, the lost EITC takes 14.7% of a mother’s pay, close to the 17.2% taken by income and payroll tax. Related articles:
Read More
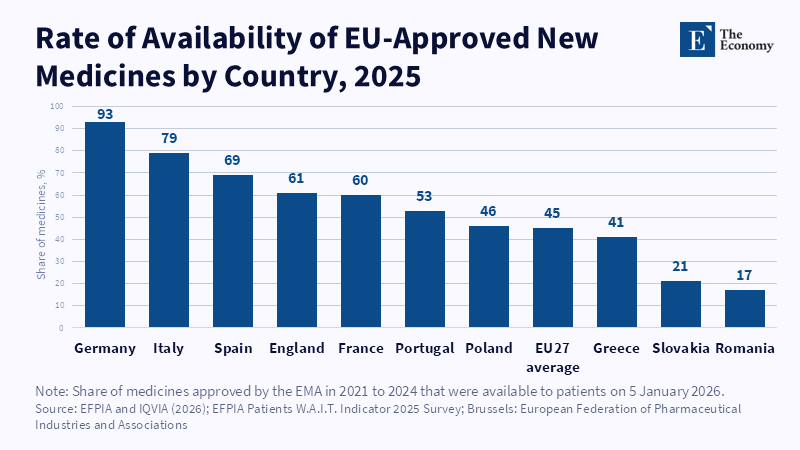
Figure: One EMA approval covers the whole EU, yet patients in Germany can get 93% of new medicines and patients in Romania only 17%. Related articles:
Read More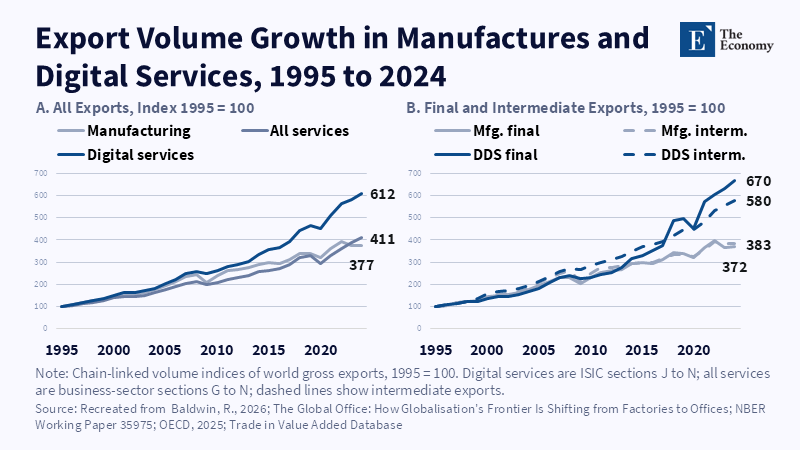
Figure: Digital services exports kept growing through the 2008 slump and reached six times their 1995 level, while manufactures stalled below four times. Related articles:
Read More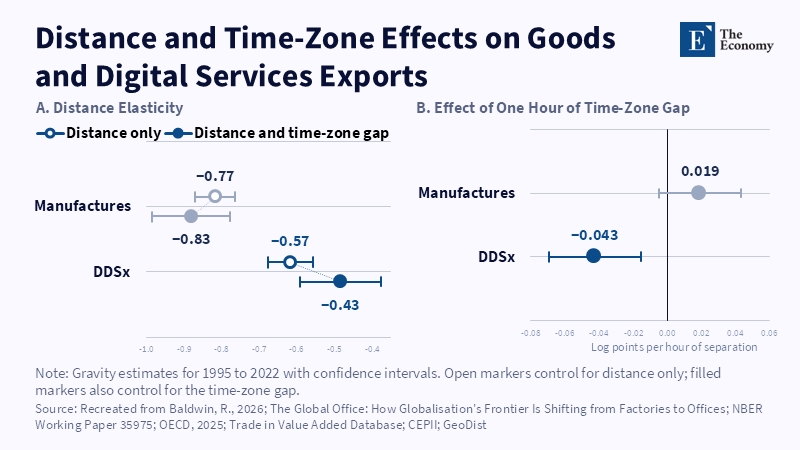
Figure: Every extra hour of time difference cuts digital services exports by about 4 percent, while goods trade is unaffected. Related articles:
Read More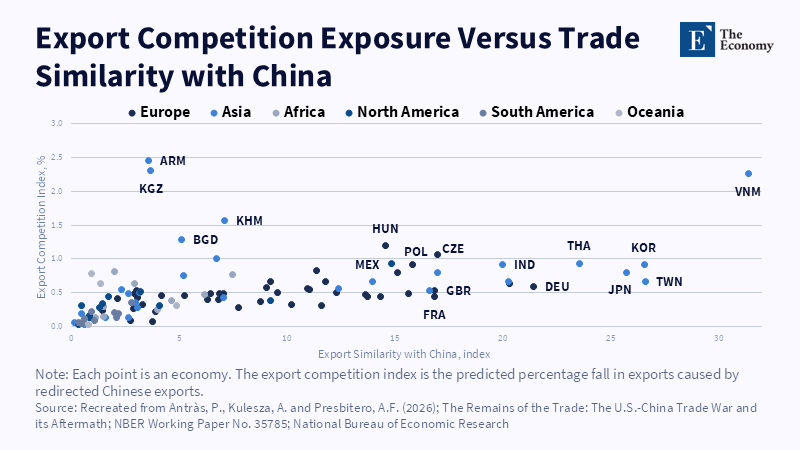
Figure: Germany’s exports closely resemble China’s, yet several smaller Asian economies face far more competition from redirected Chinese goods. Related articles:
Read More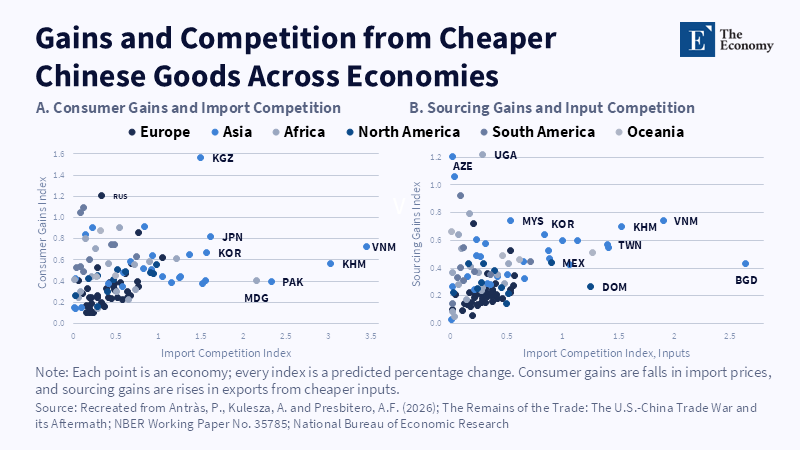
Figure: The economies most exposed to Chinese competition often gain the most from cheaper Chinese goods and inputs. Related articles: U.S.-China
Read More
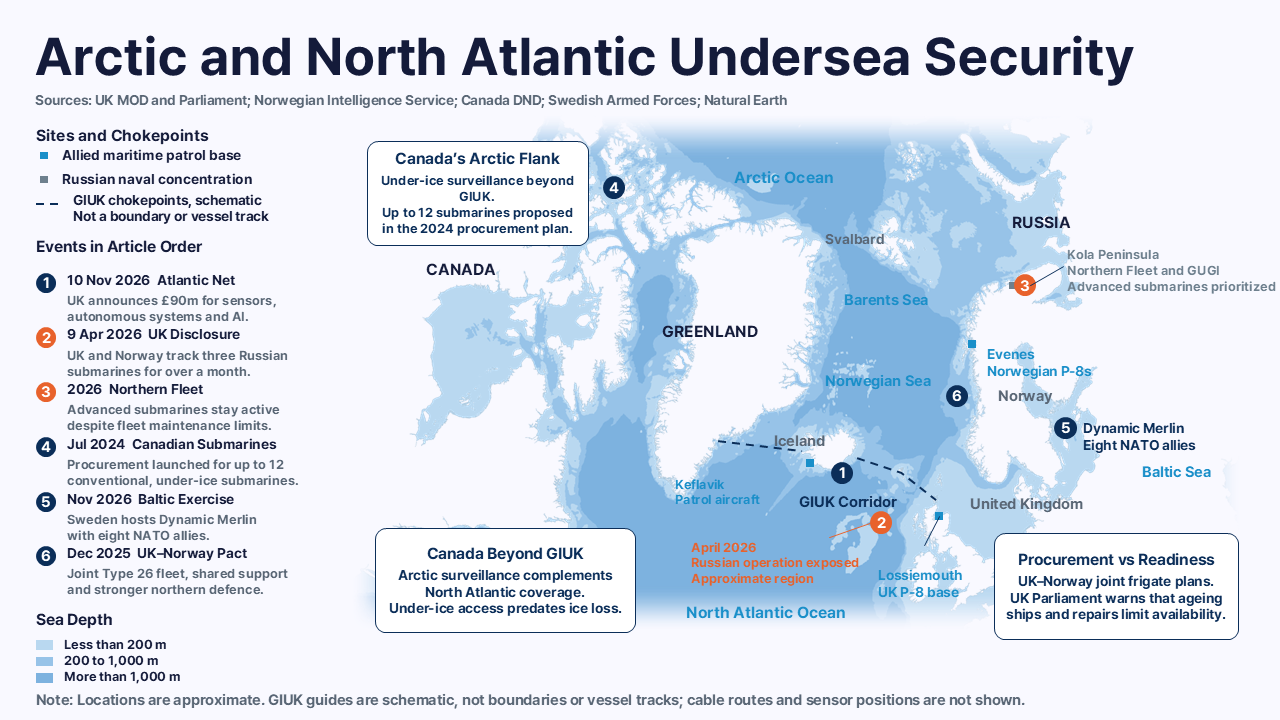
Note: The map shows Russian Northern Fleet submarine bases and key surveillance and response activities by the UK, Nordic countries and Canada.
Read More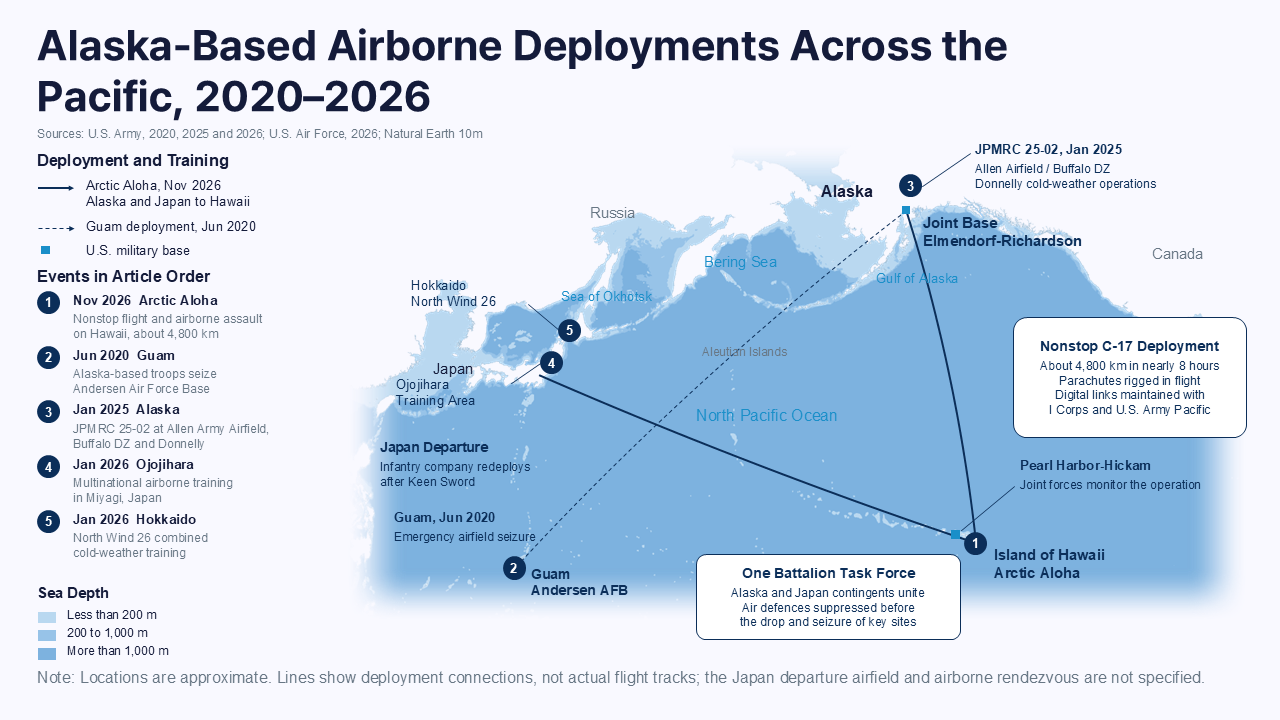
Related articles: Flying 4,800 km, parachuting in and heading straight into battle: Alaska-based U.S.
Read More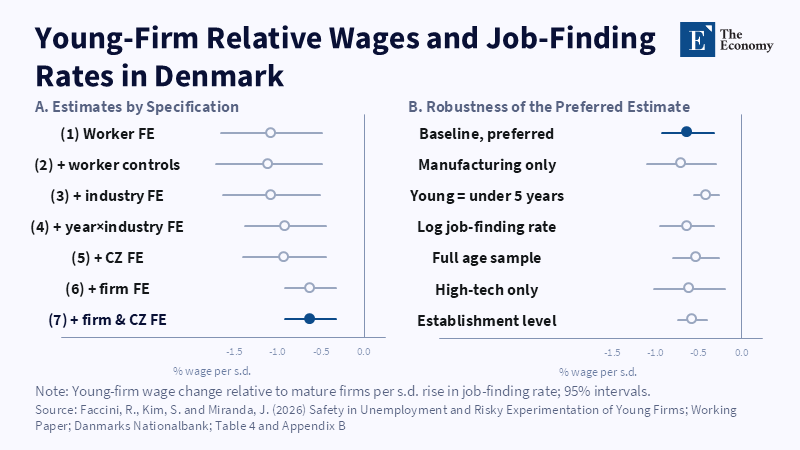
Figure: In every specification, young firms pay less relative to mature firms where jobs are easier to find. Related articles: Europe's Innova
Read More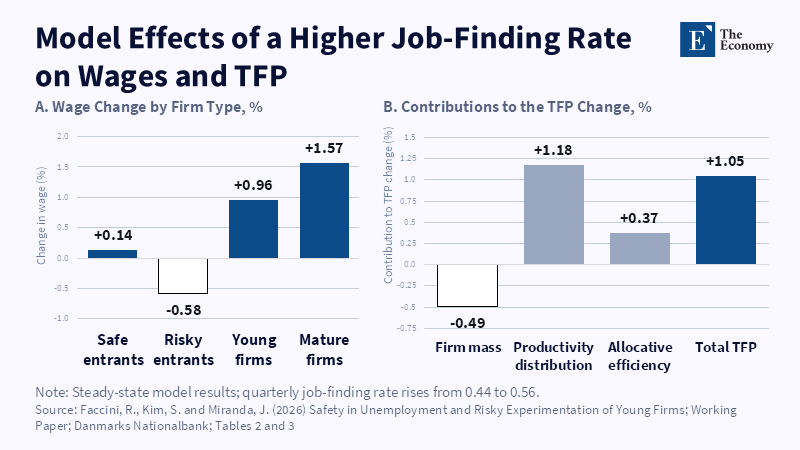
Figure: Faster re-employment cuts pay at risky entrants and lifts aggregate productivity by about 1% in the model. Related articles: Europe's
Read More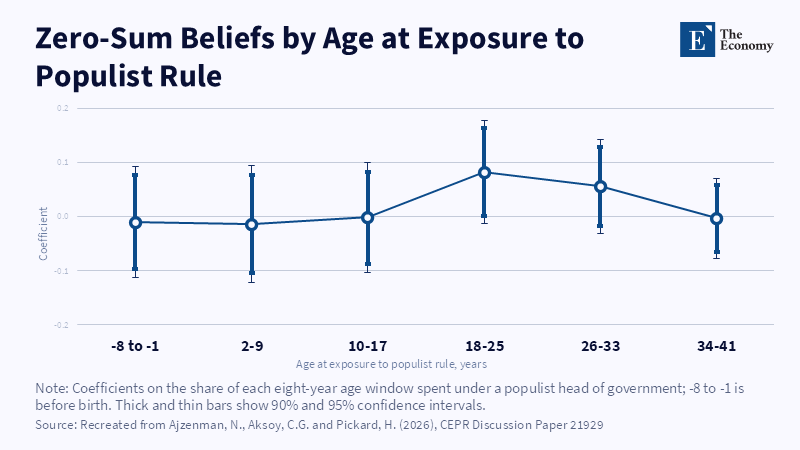
Figure: Populist rule raises zero-sum beliefs only when experienced between ages 18 and 25. Related articles: Populism's Zero-Sum Legacy:
Read More