Financial
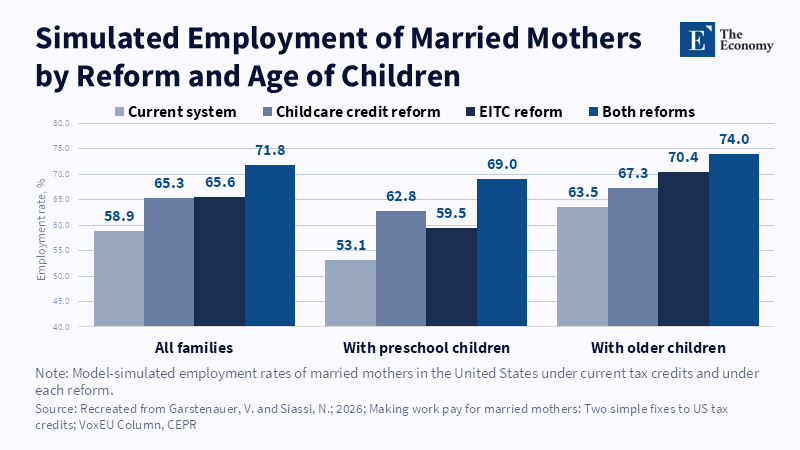
Figure: Mothers of preschool children start lowest, at 53.1% and gain more from the childcare credit reform than from the EITC change. Related articles:
Read More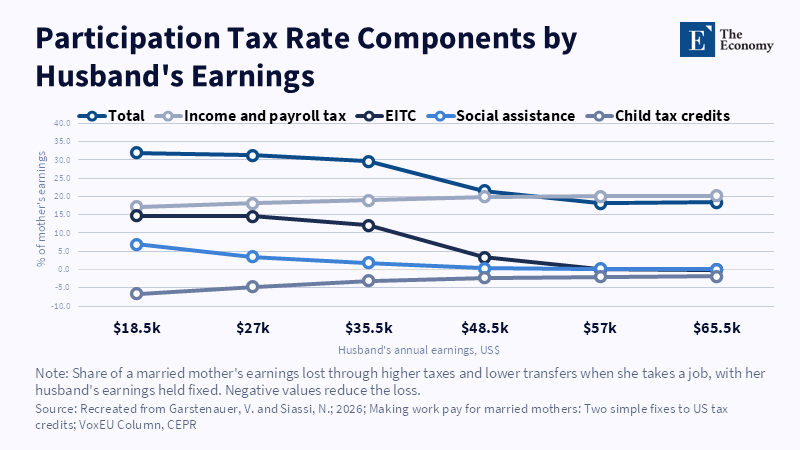
Figure: When the husband earns $18,500, the lost EITC takes 14.7% of a mother’s pay, close to the 17.2% taken by income and payroll tax. Related articles:
Read More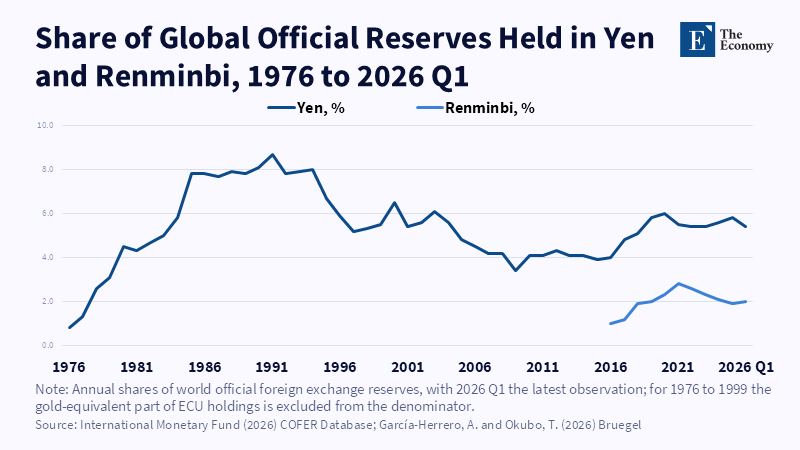
Figure: Even after Japan opened up, the yen peaked below 9%.
Read More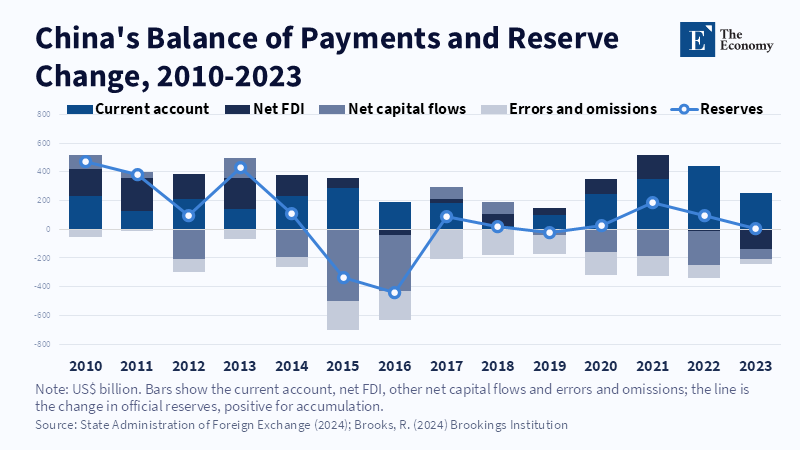
Figure: Capital outflows overwhelmed the current-account surplus in 2015 and 2016. Related articles: The Renminbi's
Read More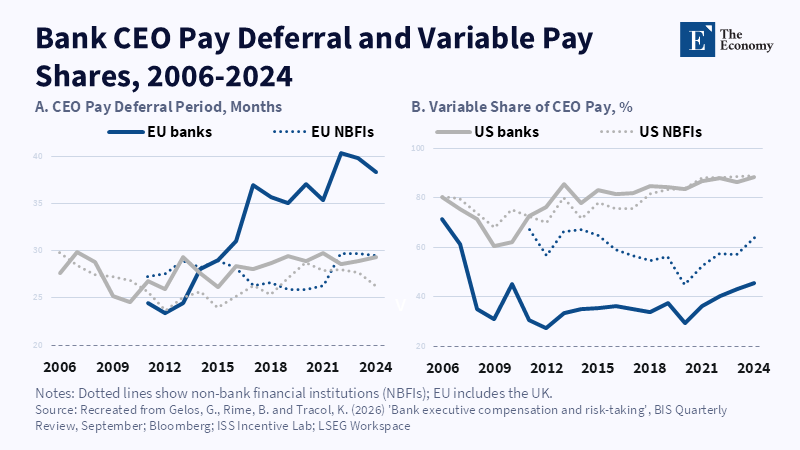
Figure: European banks lengthened CEO deferral after 2016; U.S.
Read More







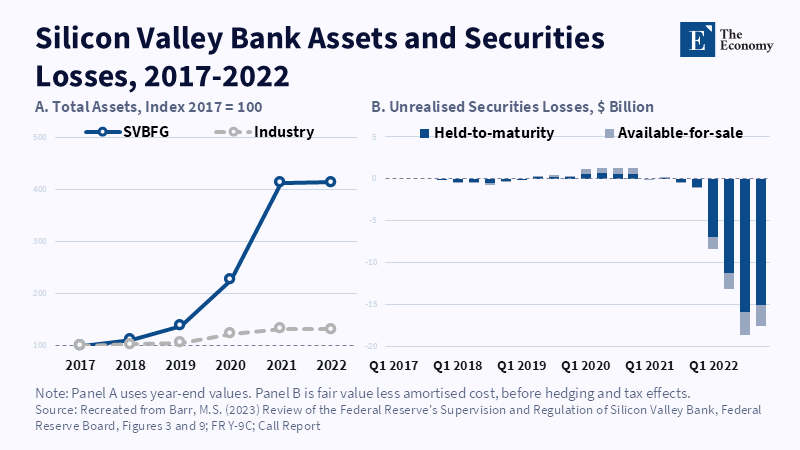
Figure: SVB quadrupled its assets, then its securities losses built up within 2022. Related articles: Bank Executive Compensation in the Age of D
Read More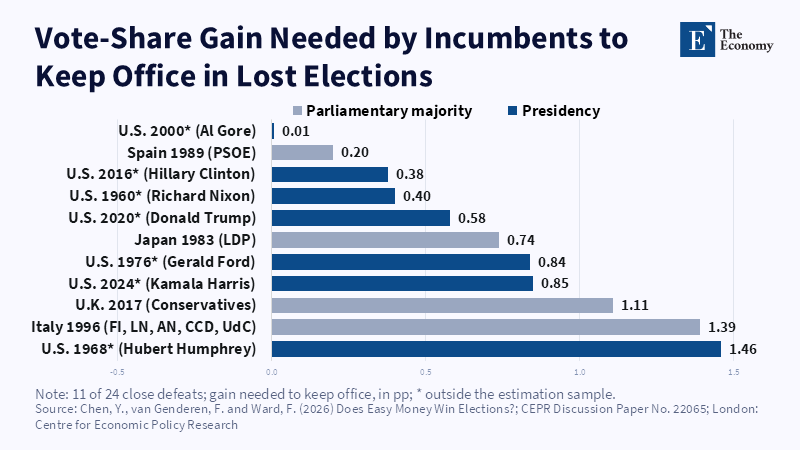
Figure: Most defeated incumbents needed more than any typical easing could deliver. Related articles: Easy Money May Not Win Elections, but Its Ec
Read More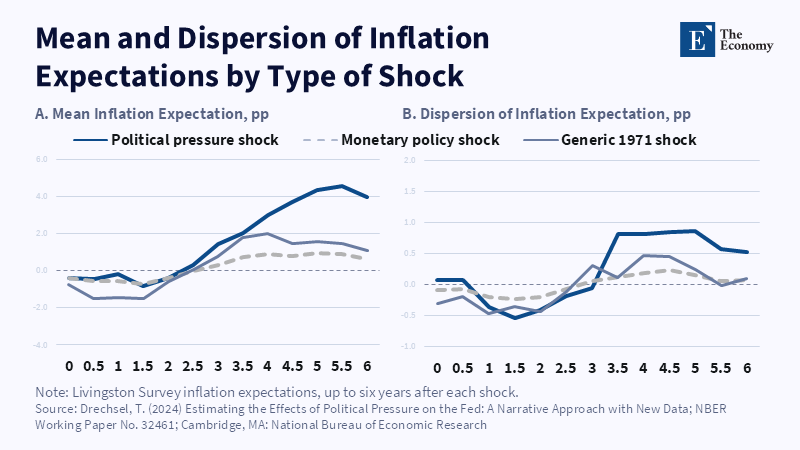
Figure: Political pressure lifts expectations further and wider than ordinary easing. Related articles: Easy Money May Not Win Elections, but Its
Read More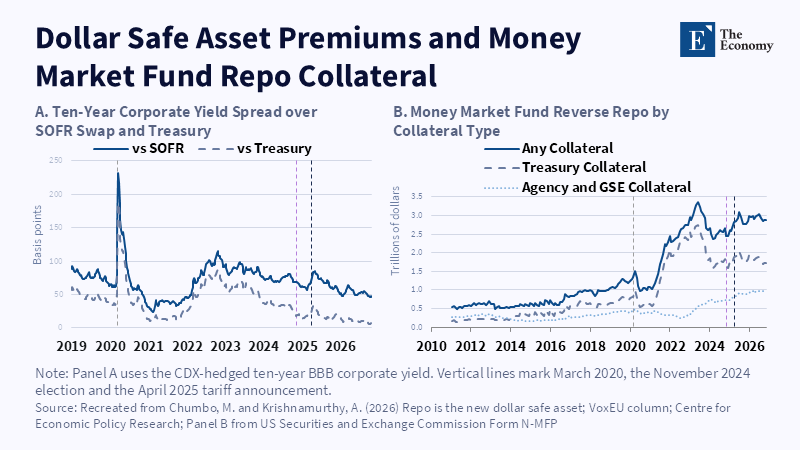
Figure: The convenience premium on long-term Treasuries has declined, while money market funds have increasingly used agency and GSE repo collateral. Related articles:
Read More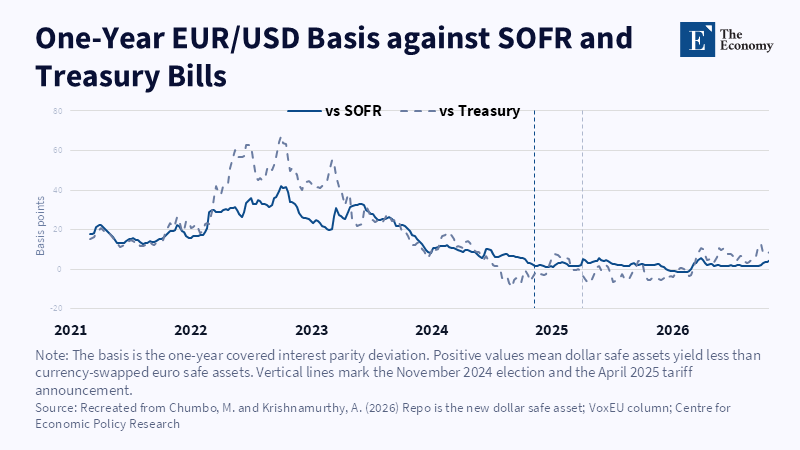
Figure: The dollar safe-asset premium against euro alternatives has narrowed substantially since 2022, approaching zero in recent years. Related articles:
Read More
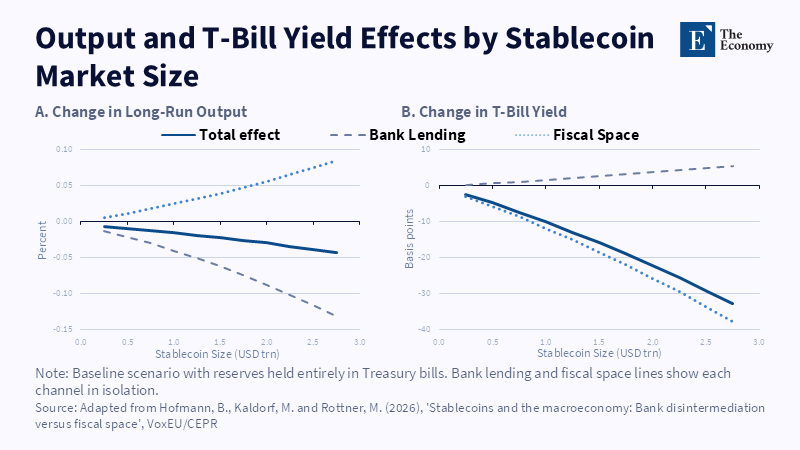
Figure: Stablecoin market expansion affects bank lending and Treasury yields but has a limited long-run impact on output. Related articles:
Read More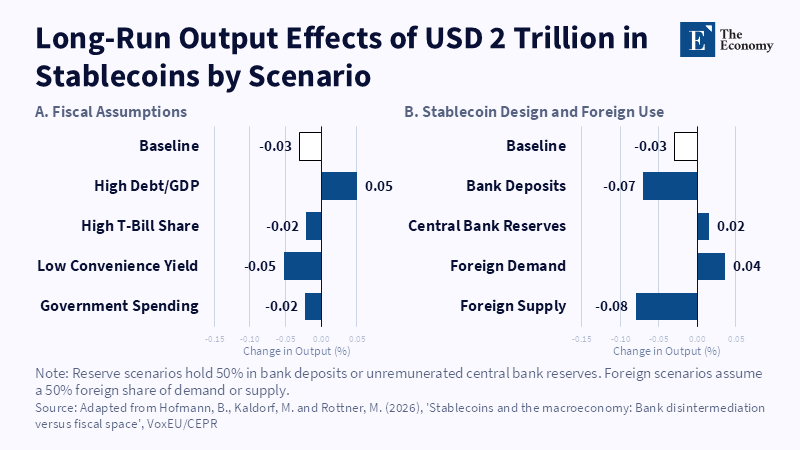
Figure: Reserve requirements, fiscal conditions and foreign adoption influence the direction and size of stablecoins’ long-run output effects. Related articles:
Read More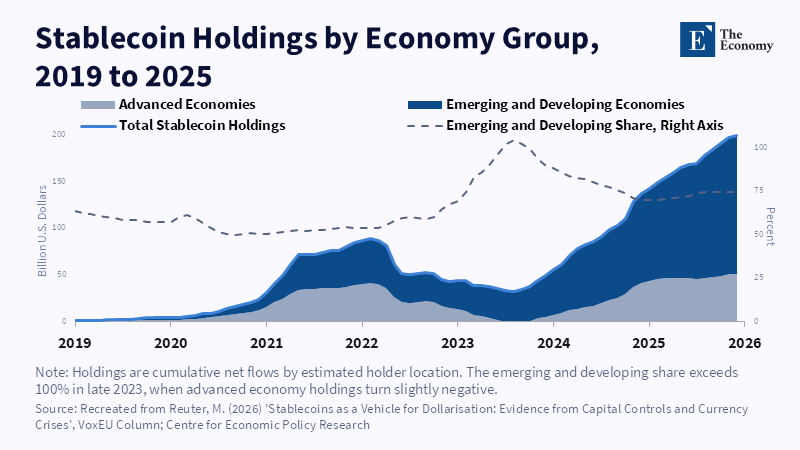
Figure: Emerging economies now hold three quarters of tracked stablecoins, up from about half in 2021. Related articles: Stablecoin Dollarization Is Wi
Read More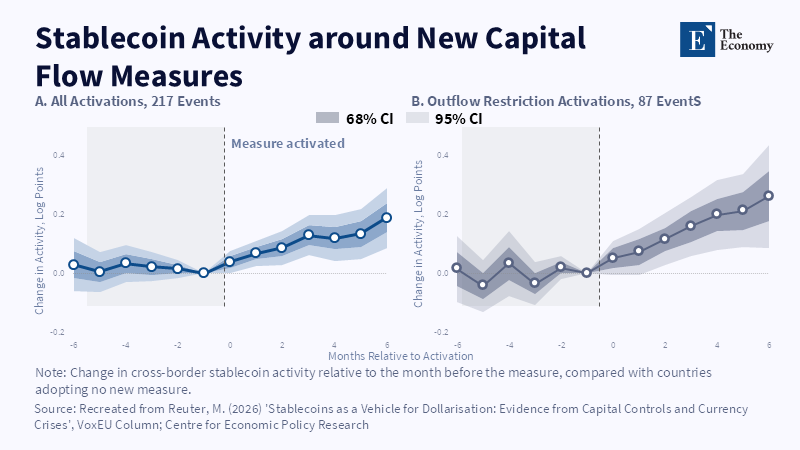
Figure: Cross-border stablecoin activity rises after capital controls are introduced, with stronger increases following restrictions on capital outflows. Related articles:
Read More
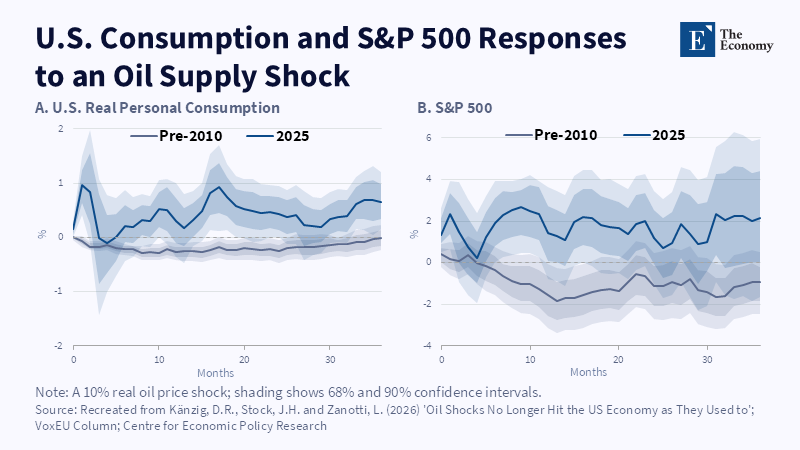
Figure: At the 2025 trade position, consumption and share prices rise after an oil supply shock instead of falling. Related articles: Oil Pr
Read More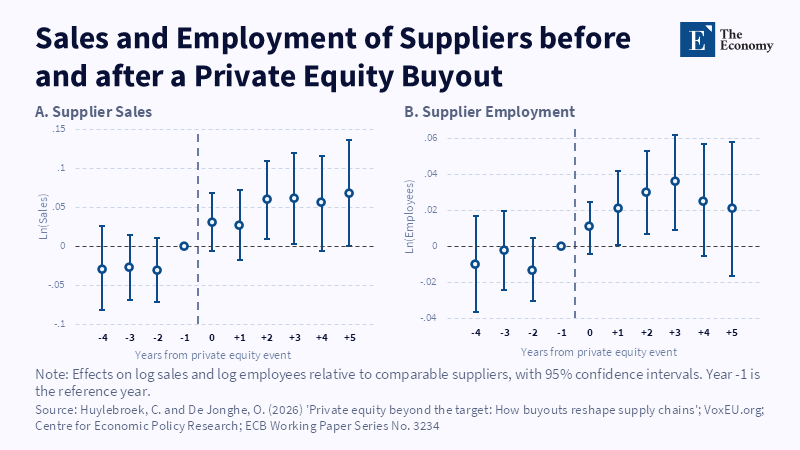
Figure: Suppliers show no gap before the buyout and pull ahead after it, more in sales than in jobs. Related articles: Merger Revi
Read More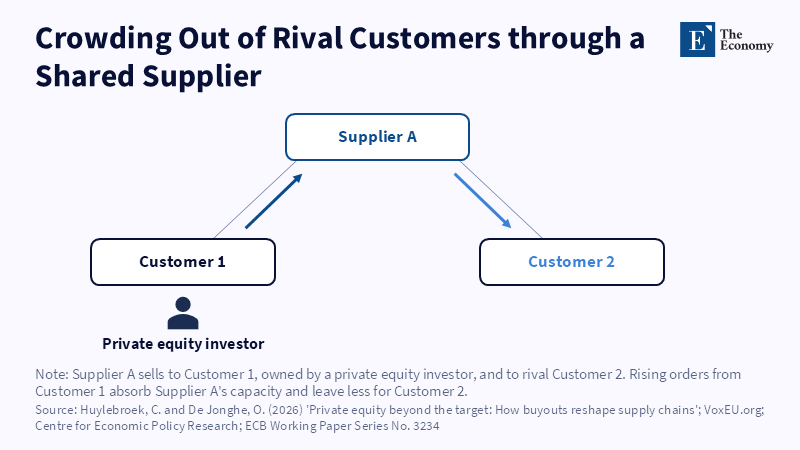
Figure: A rival can lose a supplier’s capacity without being part of the deal. Related articles: Merger Review Misses the Supply
Read More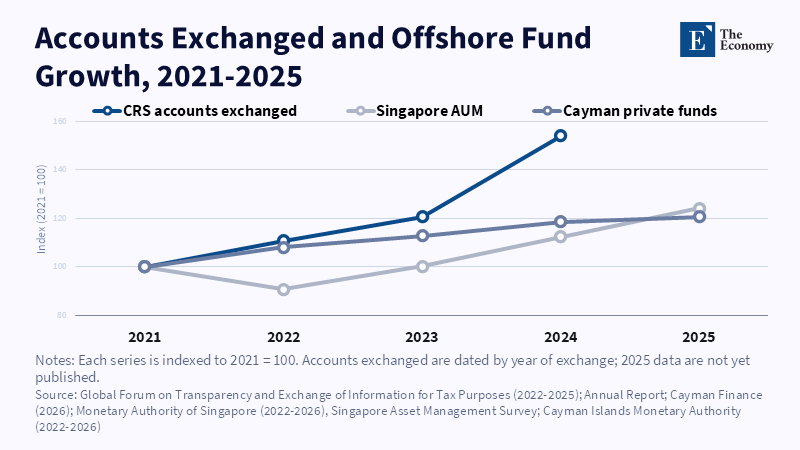
Figure: Accounts reported to tax authorities rose 54% between 2021 and 2024, while Cayman private funds grew 21% and Singapore’s managed assets 24% by 2025. Related articles:
Read More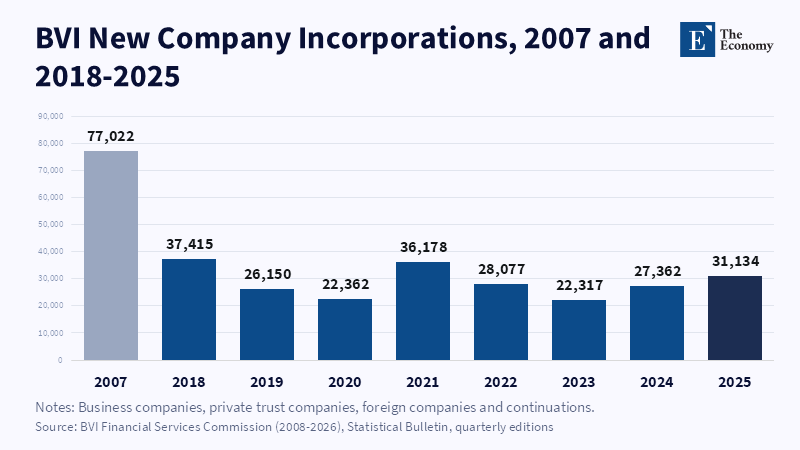
Figure: The 2025 rebound to 31,134 new companies still left BVI incorporations at 40% of their 2007 peak. Related articles: [Offshore Finance]
Read More