Financial
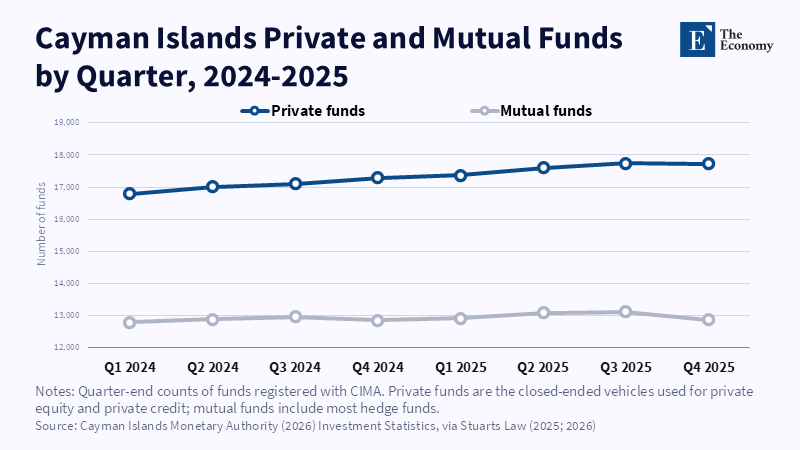
Figure: Cayman’s growth now comes from private capital.
Read More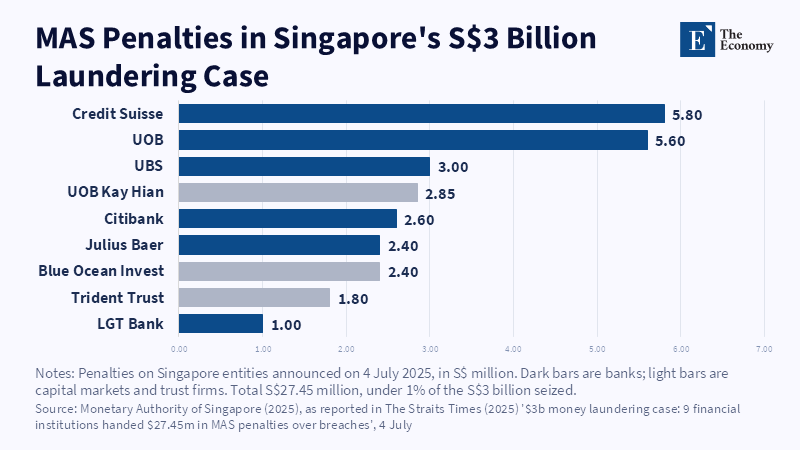
Figure: Nine institutions paid S$27.45 million between them, less than 1% of the assets seized. Related articles: [Offshore Finance] Not A
Read More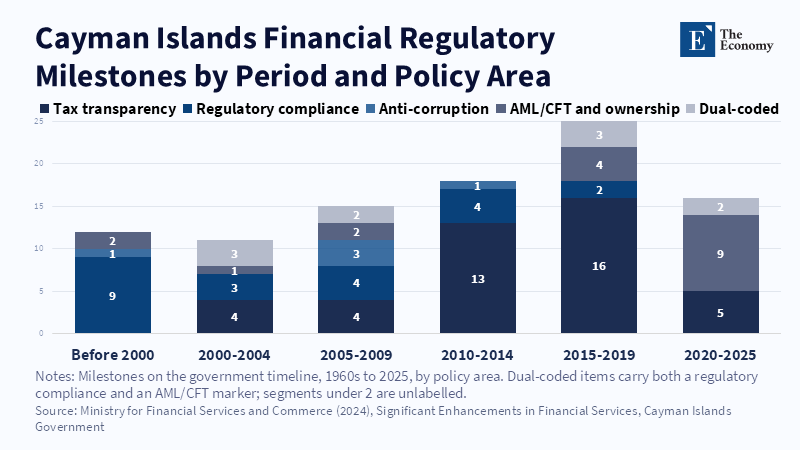
Figure: Tax transparency dominated the 2010s; after 2020 reform shifted almost entirely to anti-money laundering and beneficial ownership. Related articles:
Read More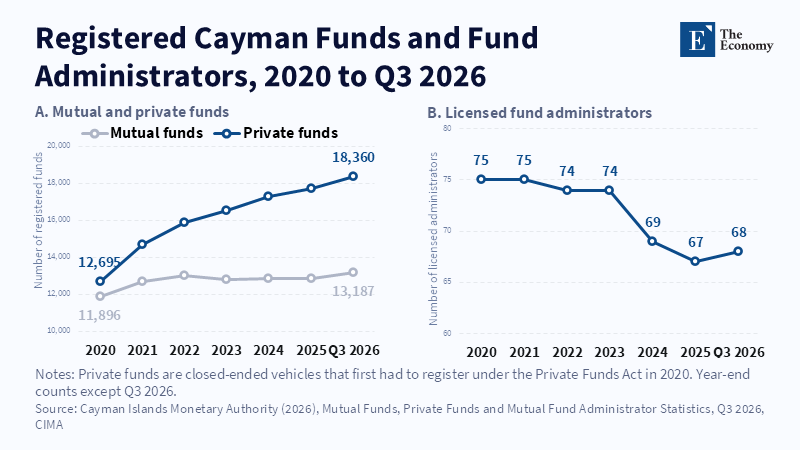
Figure: Private funds grew 45% while licensed administrators fell to 68, as compliance costs favoured larger providers. Related articles: [Offshor
Read More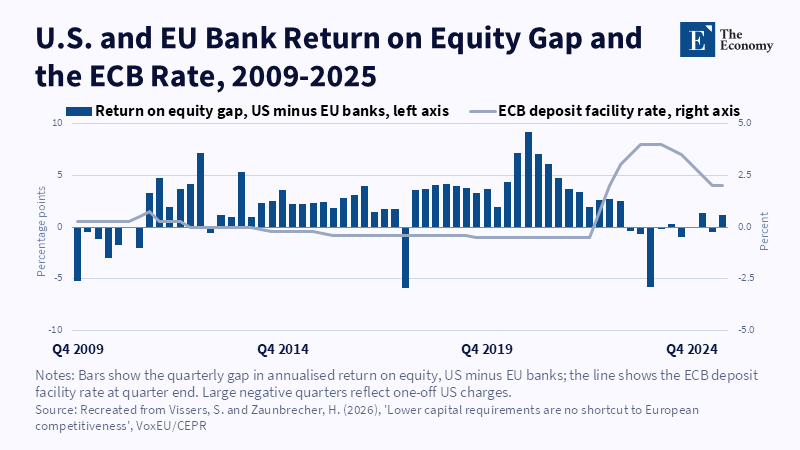
Figure: The profitability gap closed once rates rose, with no change to capital rules. Related articles: European Competitiveness: Capital Rules Built
Read More







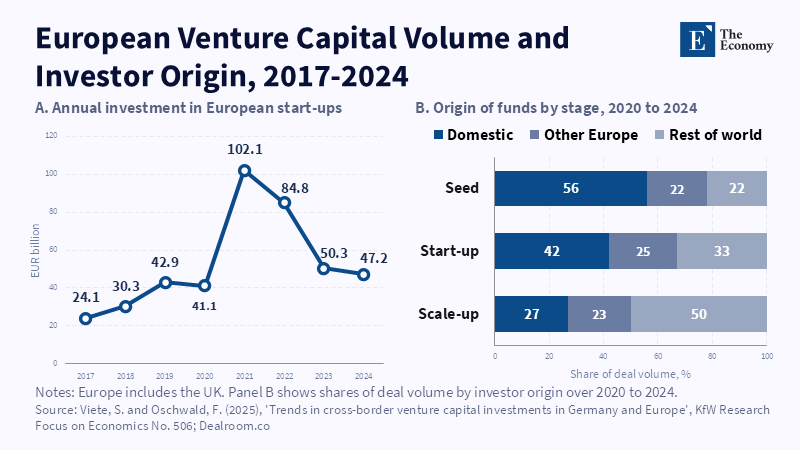
Figure: Funding halved after 2021, and scale-ups depend on capital from outside Europe. Related articles: European Competitiveness: Capital Rules Buil
Read More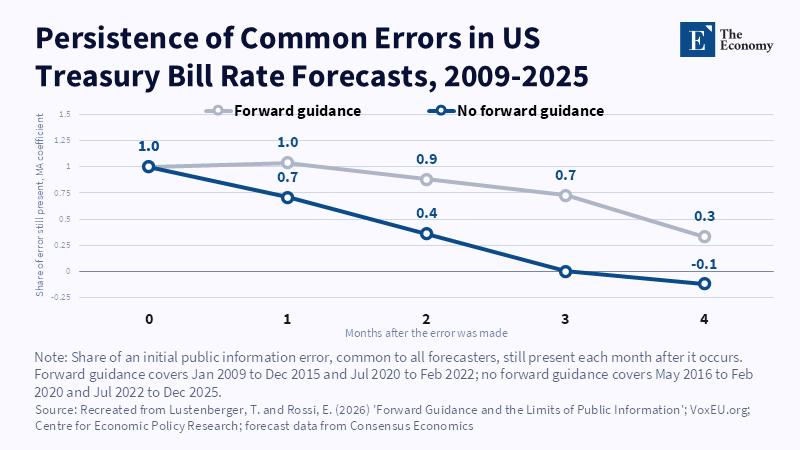
Figure: Under forward guidance, shared forecast errors were still at full size a month later. Related articles: Why Forward Guidance Fails in an Era of S
Read More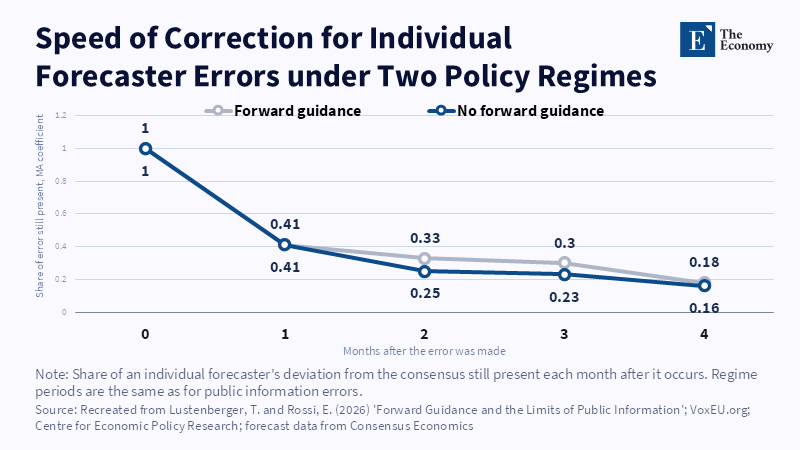
Figure: Individual forecasters corrected their own errors quickly under either regime. Related articles: Why Forward Guidance Fails in an Era of Shocks<
Read More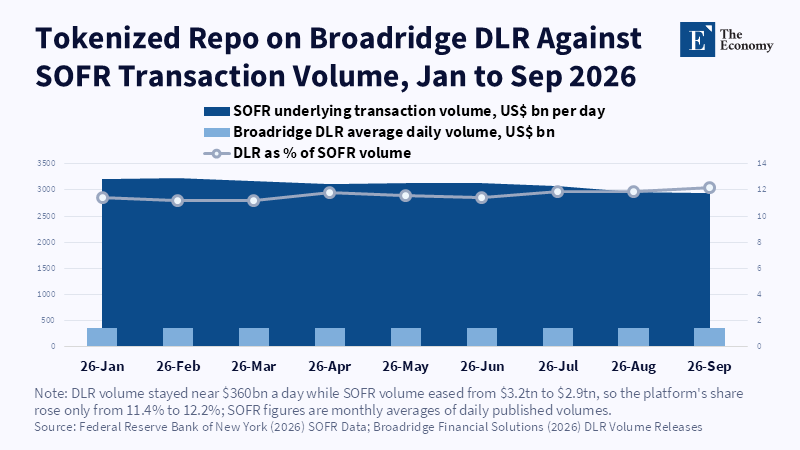
Figure: The largest tokenized repo platform handles just over a tenth of SOFR volume. Related articles:
Read More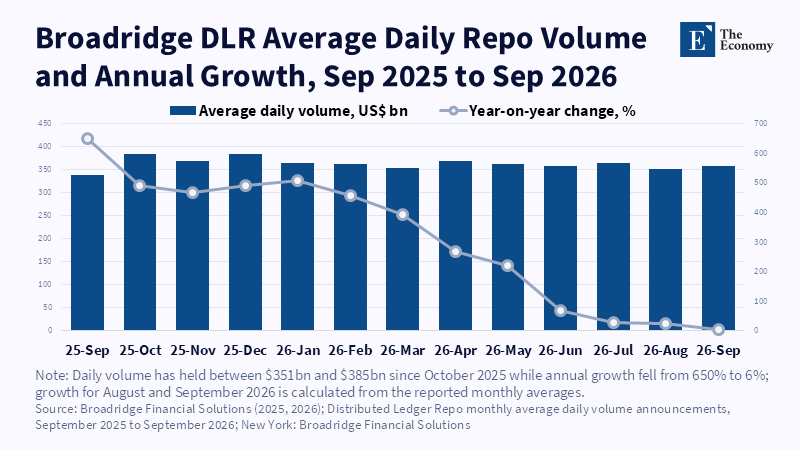
Figure: Volume plateaued near $360bn a day as annual growth fell from 650 percent to 6 percent. Related articles:
Read More
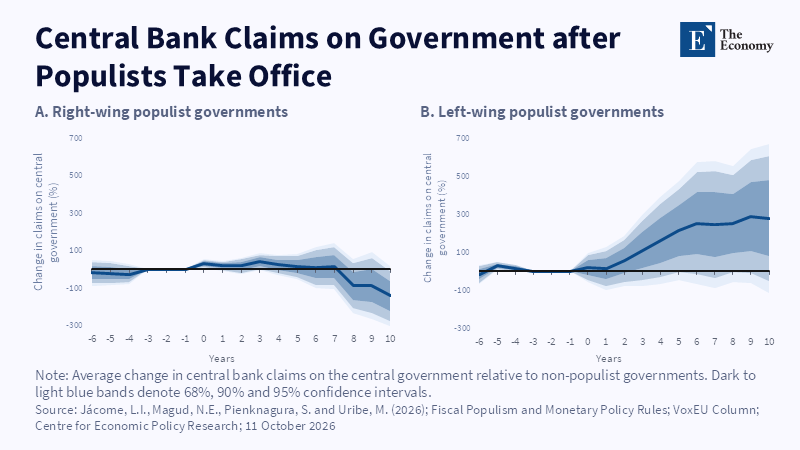
Figure: A decade after left-wing populists take office, central bank claims on the state are up close to 300%, while right-wing governments leave no lasting rise. Related articles:
Read More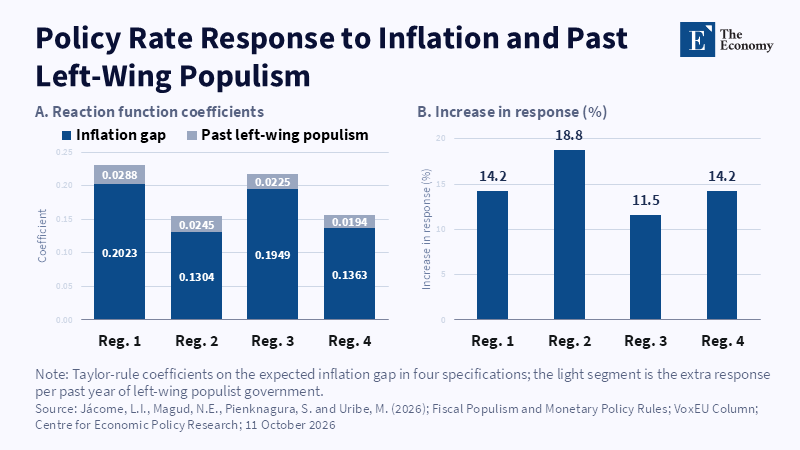
Figure: Each past year of left-wing populism makes today’s central bank react 11.5% to 18.8% harder to the same inflation gap. Related articles:
Read More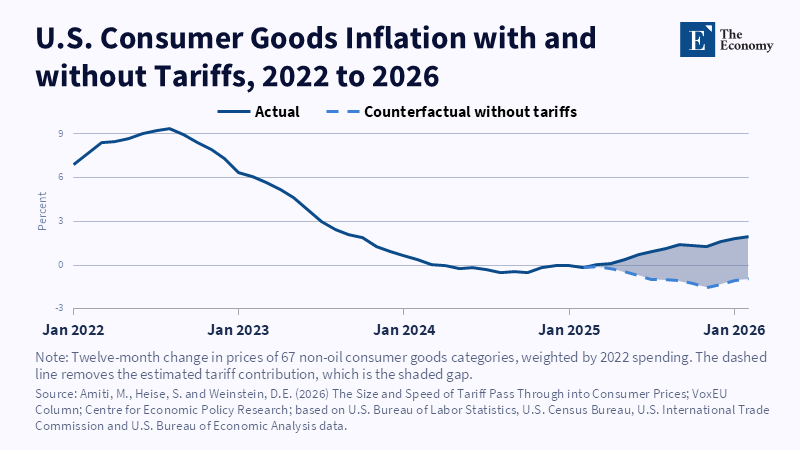
Figure: Tariffs opened a 2.9 point gap by February 2026; without them, goods prices would have been falling. Related articles:
Read More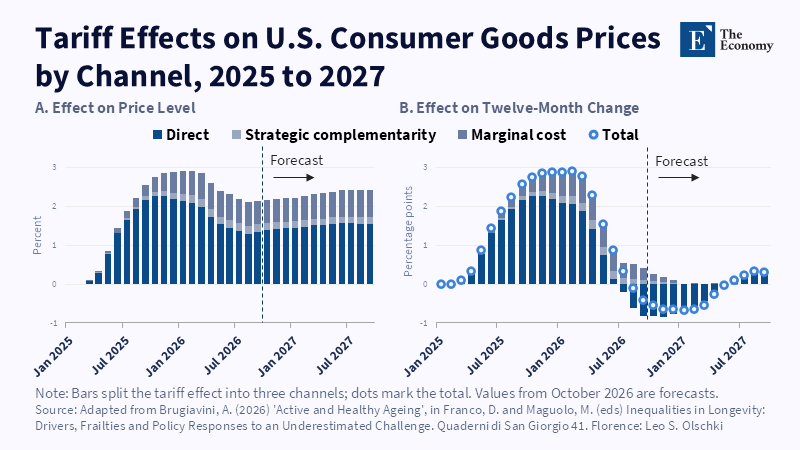
Figure: The inflation push fades to zero by August 2026, but the price level stays about 2% higher. Related articles:
Read More
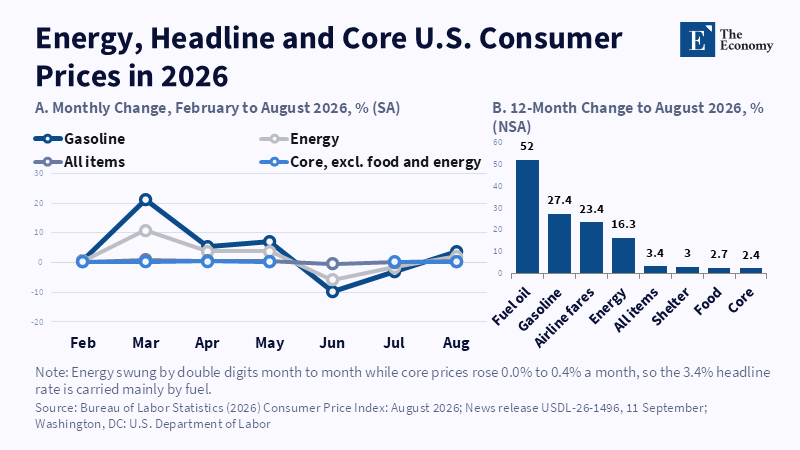
Figure 1: Gasoline jumped 21.2% in March alone while core prices never rose more than 0.4% a month. Related article:
Read More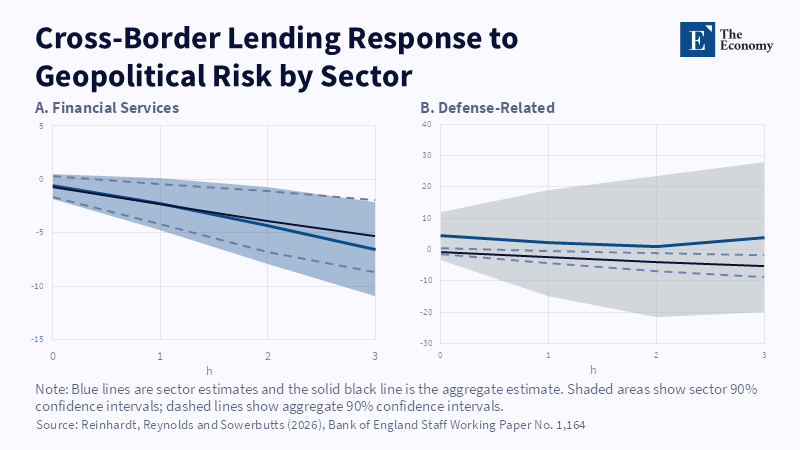
Figure 1: Lending to financial firms keeps falling across the horizon, while defence-related lending shows no clear decline. Related article:
Read More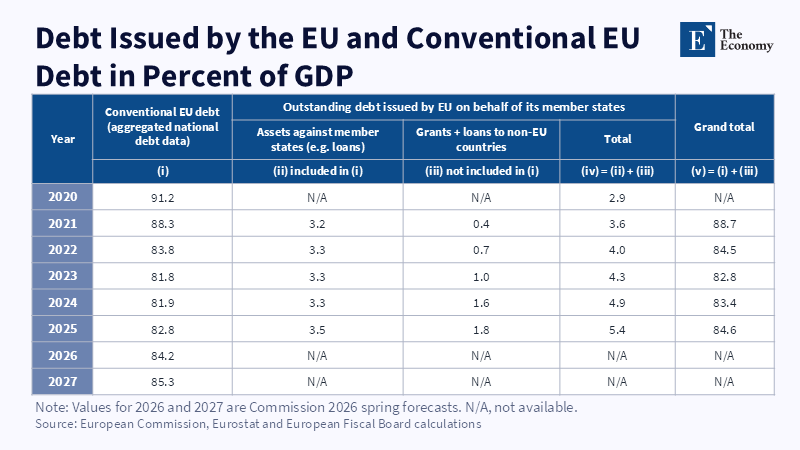
Figure 2: EU-issued debt rose from 2.9 percent to 5.4 percent of GDP between 2020 and 2025, lifting the comprehensive measure 1.8 points above the conventional one.
Read More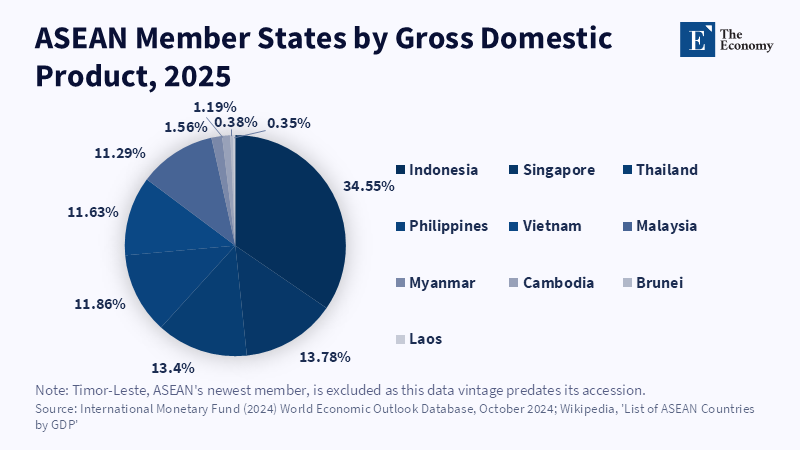
Figure 6. Indonesia’s large share highlights ASEAN’s unequal economic weights.
Read More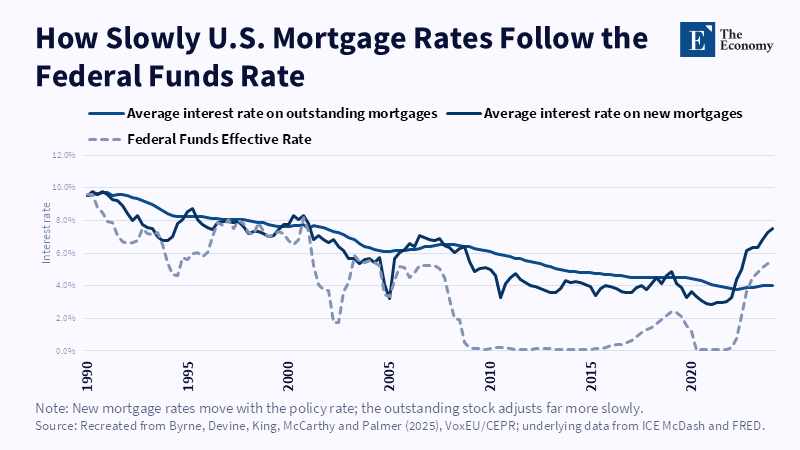
Figure 2: New mortgage rates track the federal funds rate closely; the outstanding stock adjusts far more slowly and with a lag of years. Related article:
Read More