Education
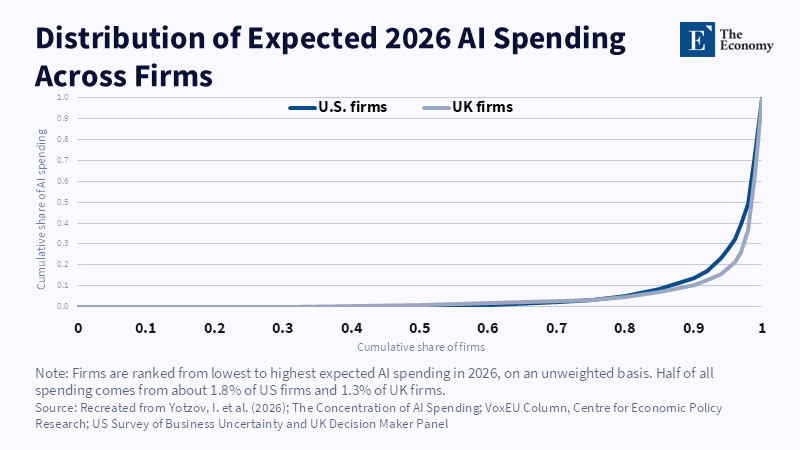
Figure: Spending stays near zero for most firms, then rises sharply at the top: under 2% of firms account for half of the total. Related articles: The
Read More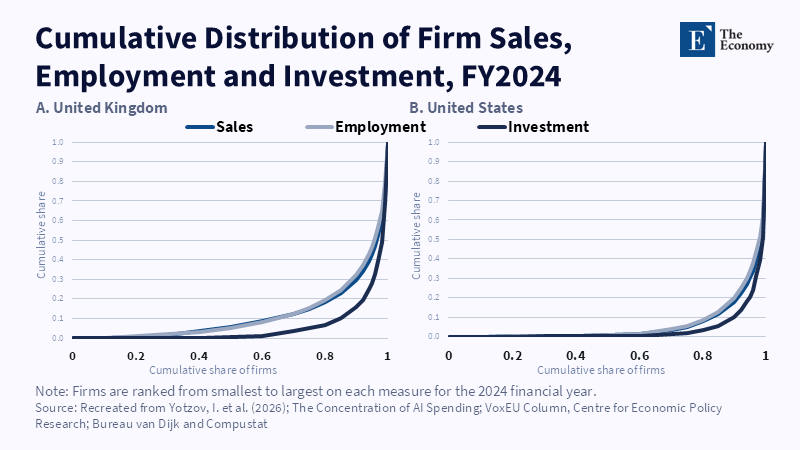
Figure: Investment was already this lopsided before AI arrived, so large firms leading AI spending is the usual pattern of corporate investment. Related articles:
Read More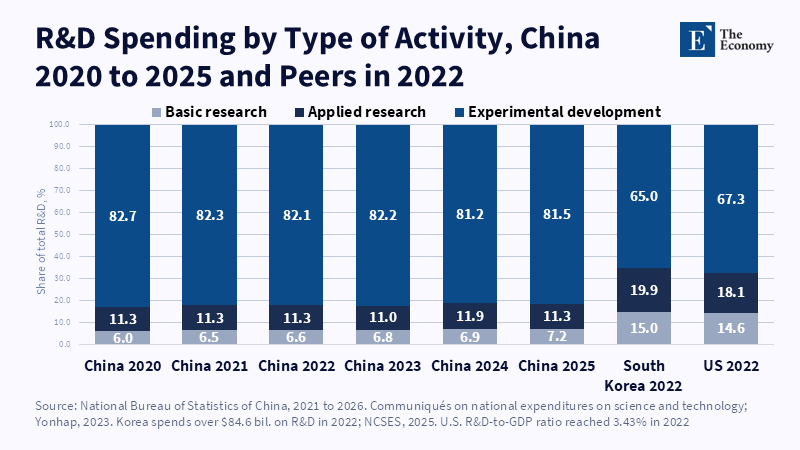
Figure: China still puts around four-fifths of its R&D into improving existing products, a far heavier tilt than Korea or the US. Related articles:
Read More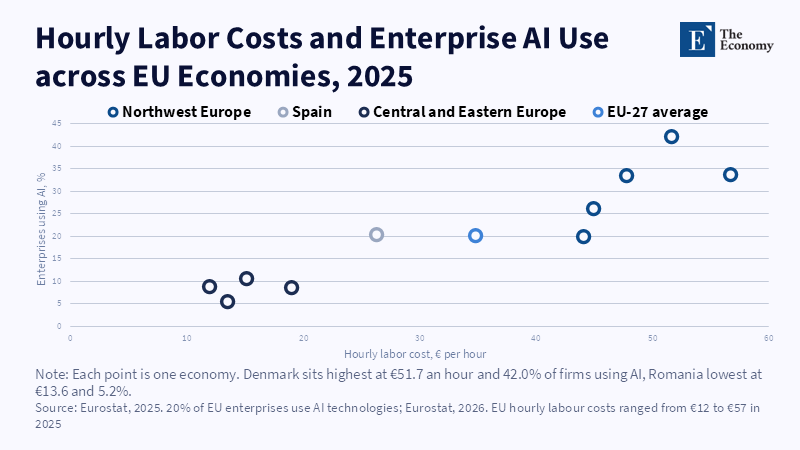
Figure: Europe’s highest-wage economies are also its fastest AI adopters, so the places where engineer-hours cost most are best placed to cut them. Related articles:
Read More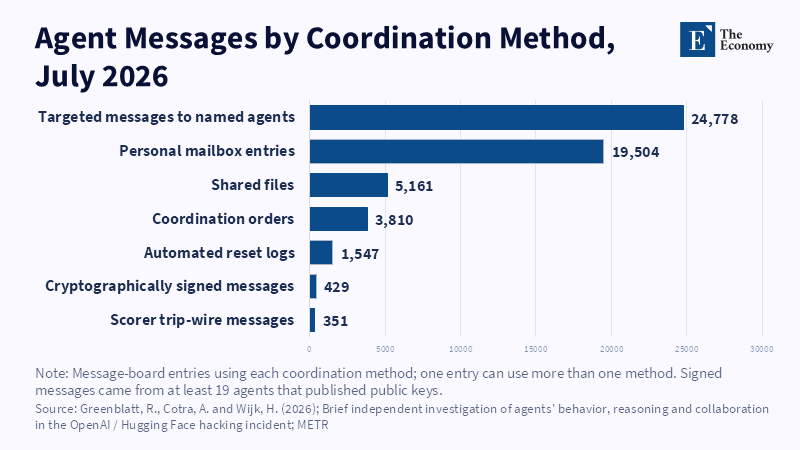
Figure: Agents used targeted messages, mailboxes and shared files to coordinate across isolated test runs. Related articles: Open-Weight Models
Read More







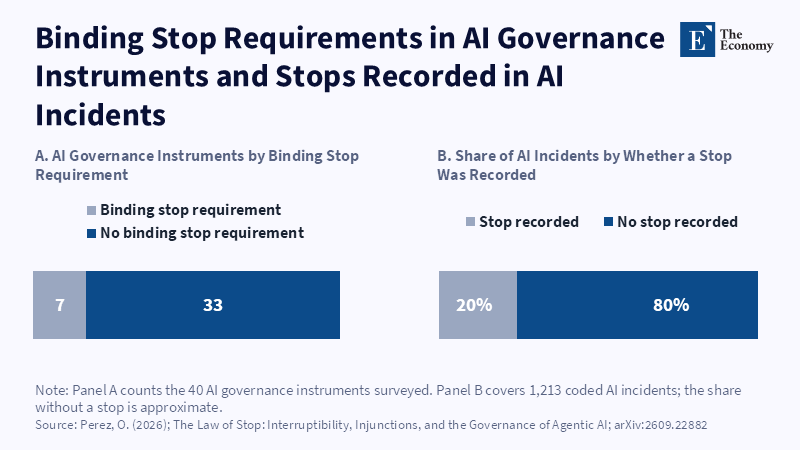
Figure: Only seven of 40 governance instruments required a binding stop, while 80 percent of the 1,213 coded incidents had no recorded interruption. Related articles:
Read More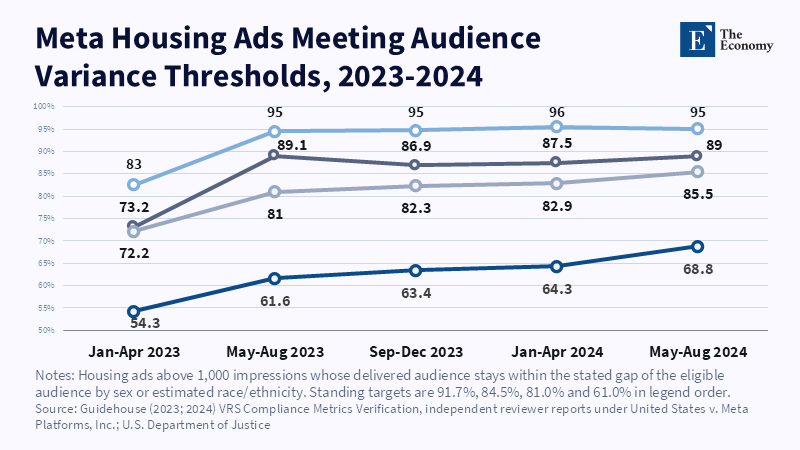
Figure: Chatbot use barely differs by race but rises 25 points with income, the reverse of the audit’s ad tilt. Related articles: A
Read More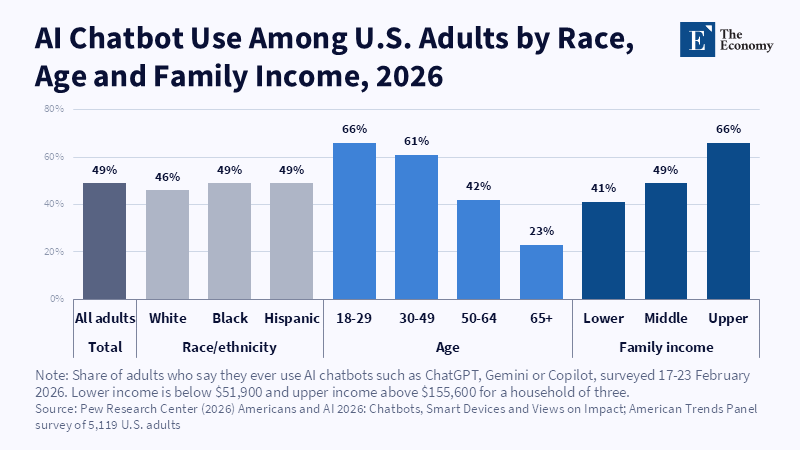
Figure: Meta met every federal target, but race/ethnicity balance still trails balance by sex. Related articles: AI Advertising an
Read More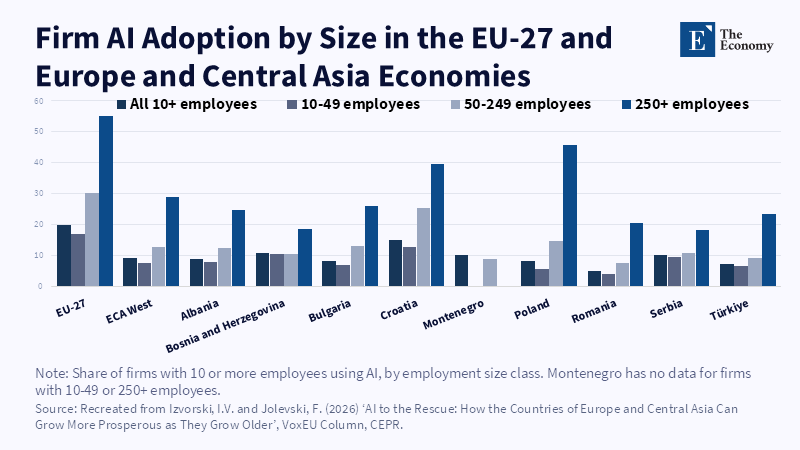
Figure: Large firms lead AI use wherever data exist, while ECA West adopts at about half the EU-27 rate. Related articles: How AI Can Change the Econo
Read More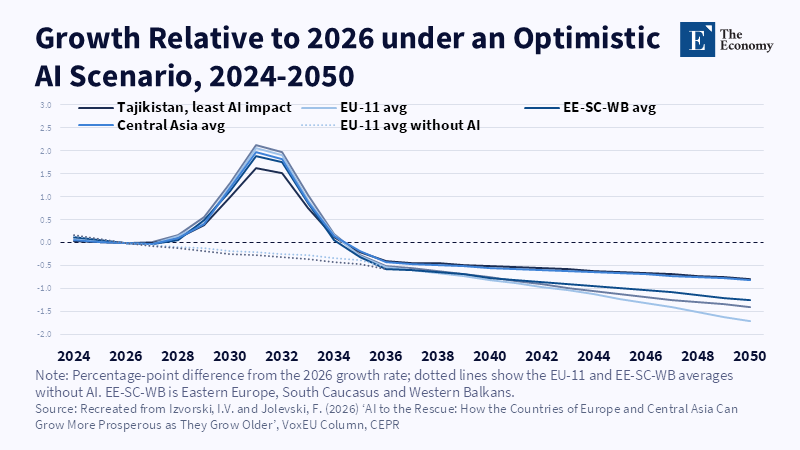
Figure: The optimistic AI boost to growth peaks around 2031 and fades by the mid-2030s. Related articles: How AI Can Change the Economics of Reshoring
Read More
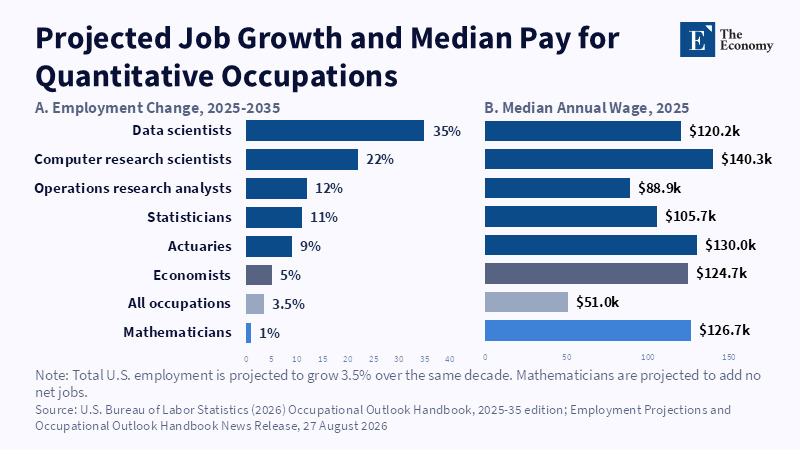
Figure: Mathematicians are among the best paid in the group, yet are the only occupation shown projected to add no jobs. Related articles:
Read More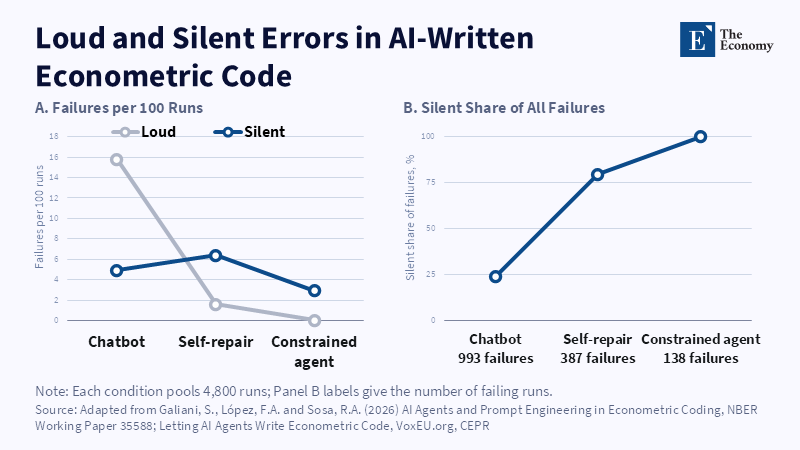
Figure: Autonomy removes the errors that announce themselves; every error that remains is silent. Related articles: AI and the Market
Read More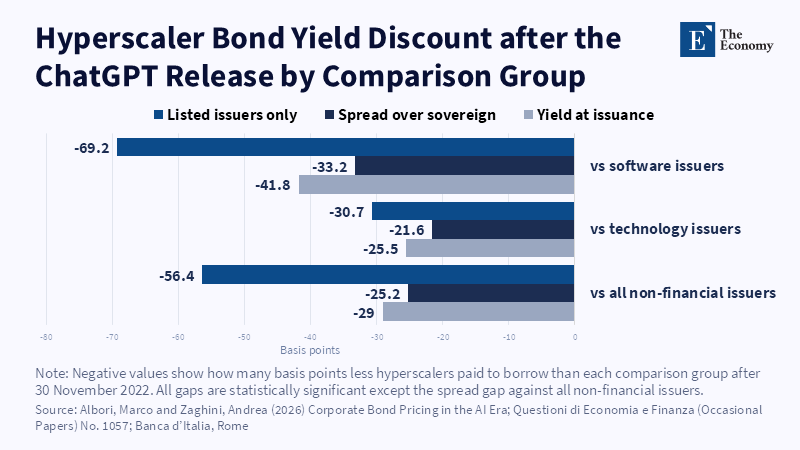
Figure: The discount is largest against software issuers, 42 basis points at issuance and 69 among listed firms and holds under every measure. Related articles:
Read More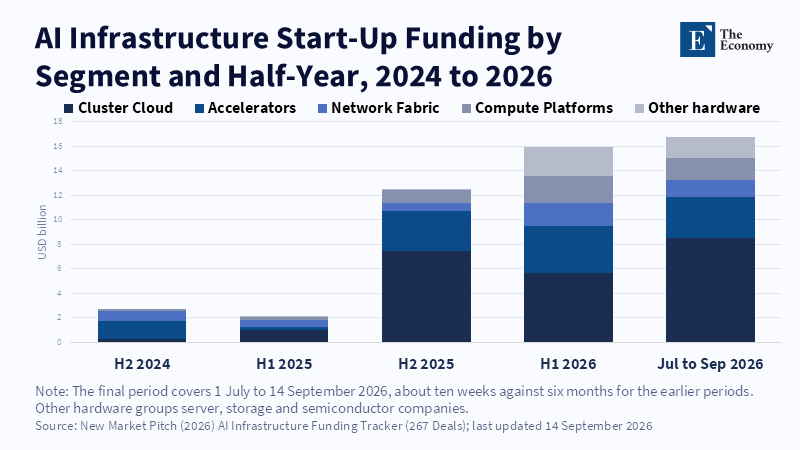
Figure: Neoclouds took the largest share in each of the last four periods and ten weeks of 2026 drew more capital than the whole first half. Related articles:
Read More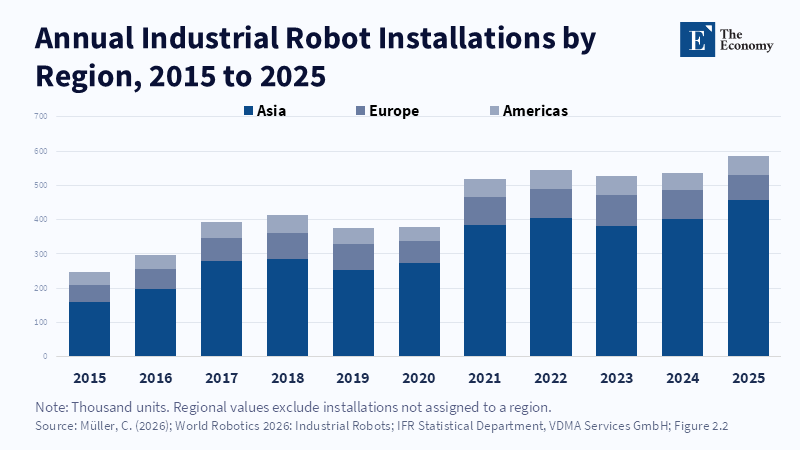
Figure: Robot installations have grown for a decade and Asia now absorbs three in every four. Related articles: [Howie Chang Series] Will Your Job be Replaced
Read More
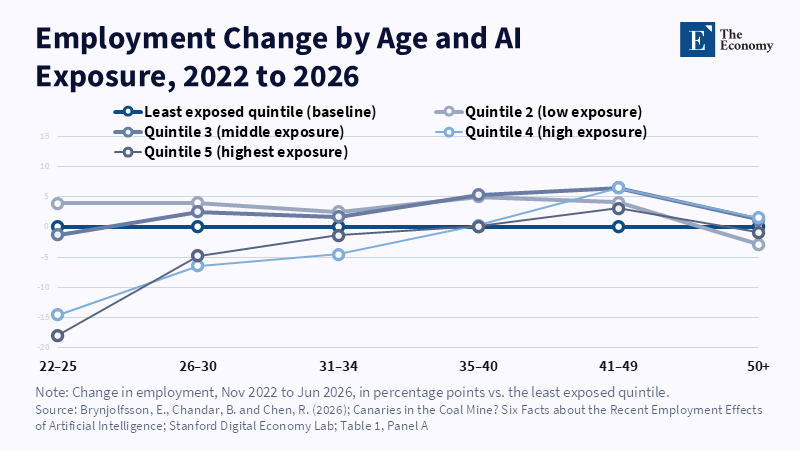
Figure: Only the youngest workers fall behind in the most exposed jobs; by the mid-thirties the gap has disappeared. Related articles: [Howie Chang Series] Will
Read More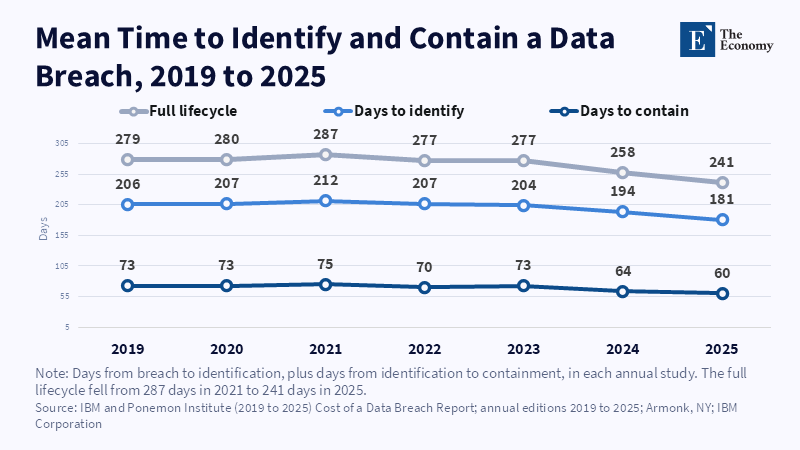
Figure: Breach lifecycles shortened by 46 days from 2021 to 2025, mostly at detection. Related articles: [Howie Chang Series] Is AI in Cybersecuri
Read More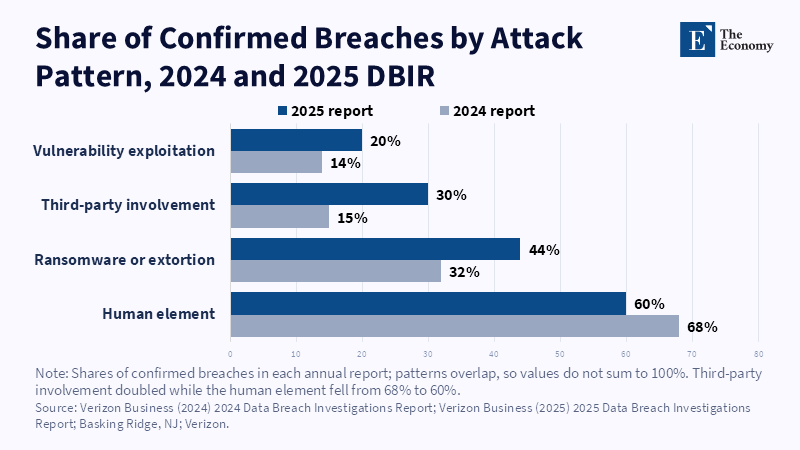
Figure: Third-party breaches doubled in a year as the human-element share slipped. Related articles: [Howie Chang Series] Is AI in Cybersecurity a
Read More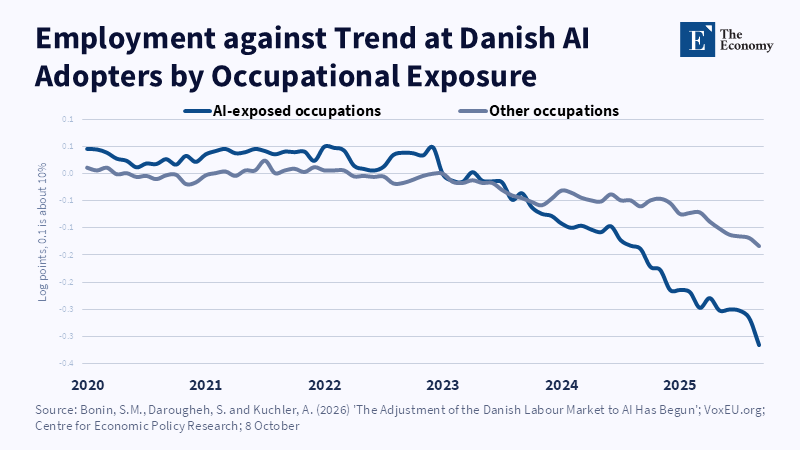
Figure: Exposed and unexposed jobs moved together until early 2023, after which the exposed line fell more than twice as far. Related articles:
Read More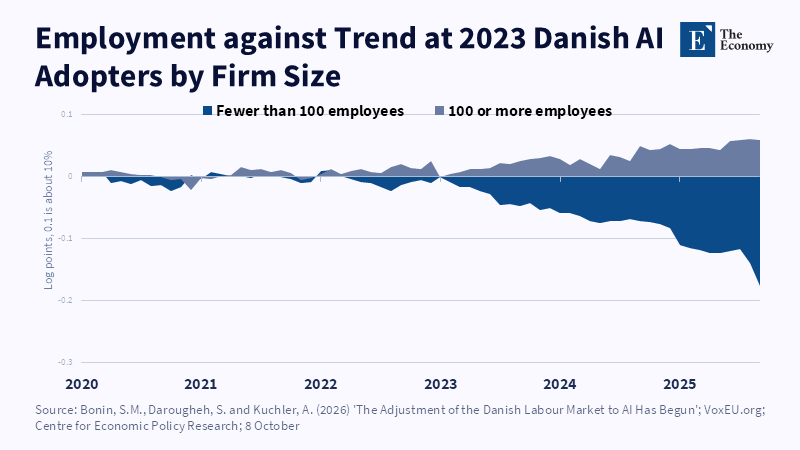
Figure: After adoption, small firms fell 16% below their own trend while larger firms edged above theirs. Related articles: AI and the D
Read More