Education
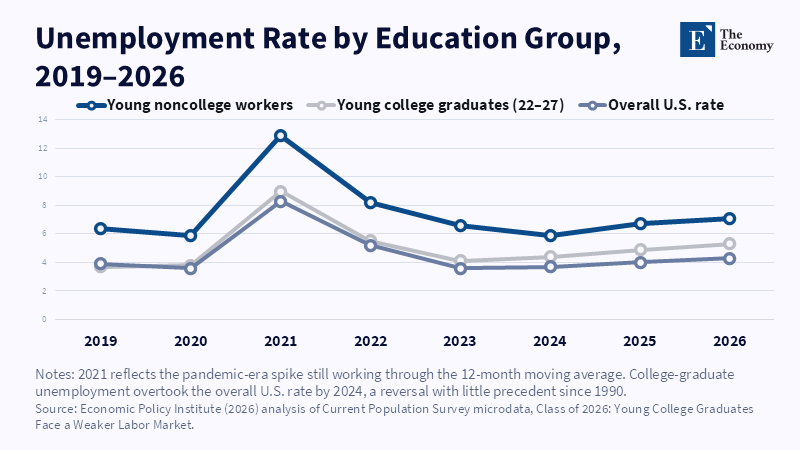
Figure: College graduates once carried a built-in employment advantage over their non-college peers.
Read More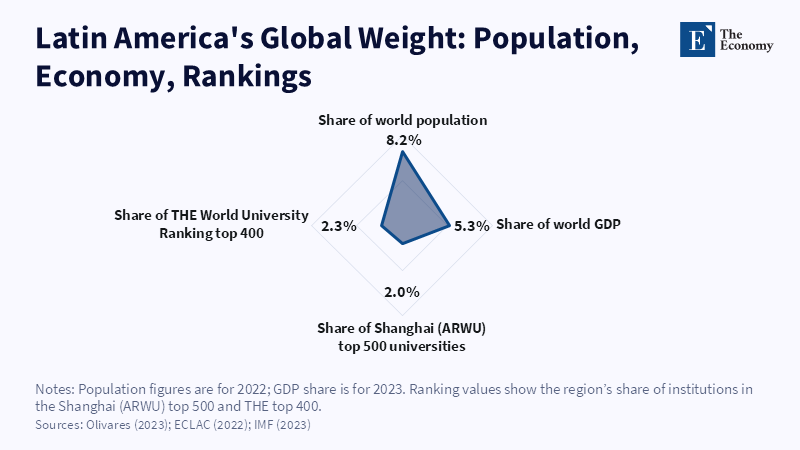
Figure: Latin America’s representation in global university rankings trails its demographic and economic weight. Related Articles: Quality Assurance Certifies
Read More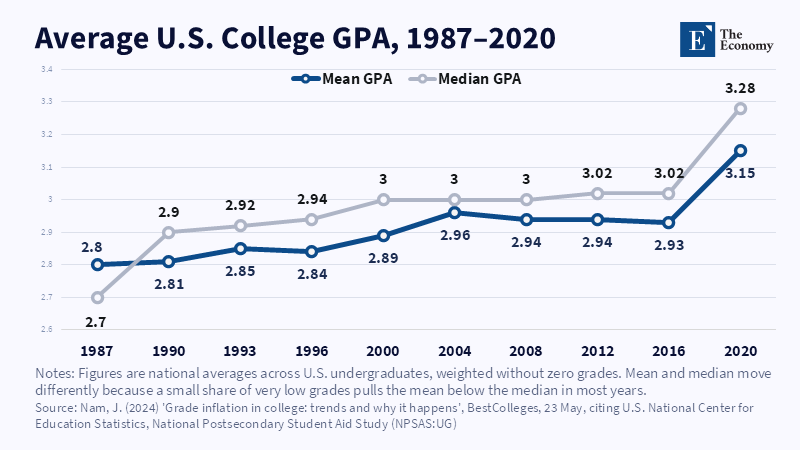
Figure: Rising U.S.
Read More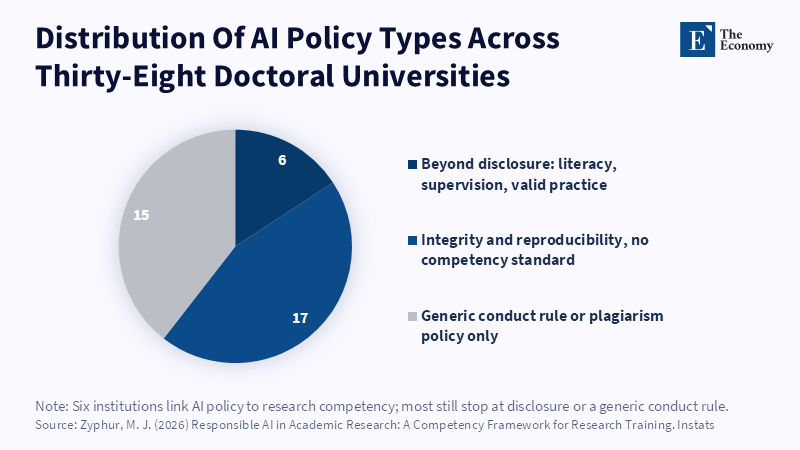
Figure: How Zyphur's 38-university sample splits across three policy types identified in his audit. Related Articles: Cognitive Internalization: The N
Read More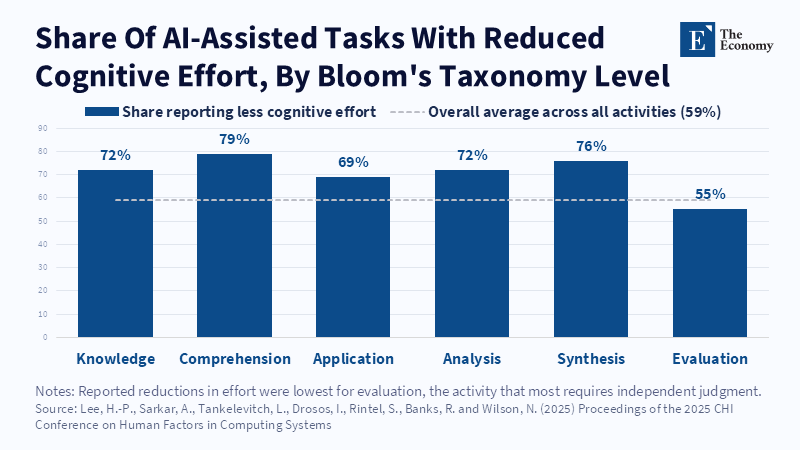
Figure: Reported reductions in effort were lowest for evaluation, the activity that most requires independent judgment. Related Articles: Cognitive Int
Read More







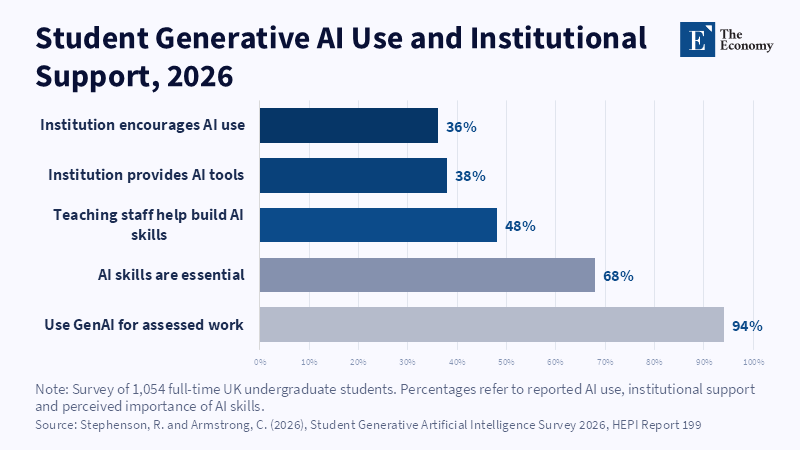
Figure: Student AI adoption far exceeds institutional support and guidance. Related Articles: Critical Thinking in Education: Assessment
Read More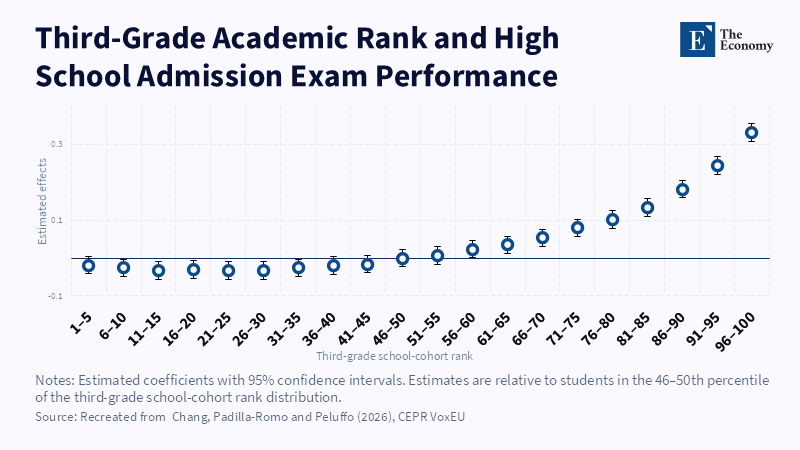
Figure: The effect of early academic rank rises sharply toward the top of the local rank distribution. Related Articles: Academic Ranking and Neighborhood
Read More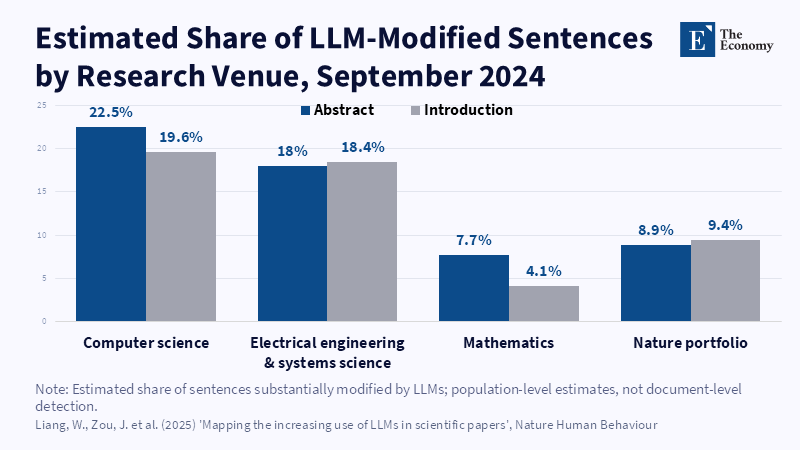
Figure: Computer science shows the sharpest jump in AI-modified writing of any field tracked. Related Articles: The Publication
Read More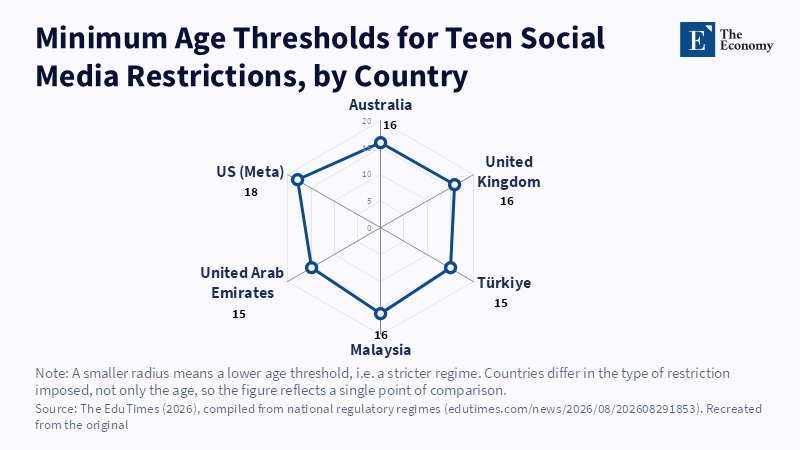
Figure: No two countries agree on the right minimum age or type of restriction. Related Articles: The Teens Who Will Bypass Meta's Two-Hour Limit | The Ec
Read More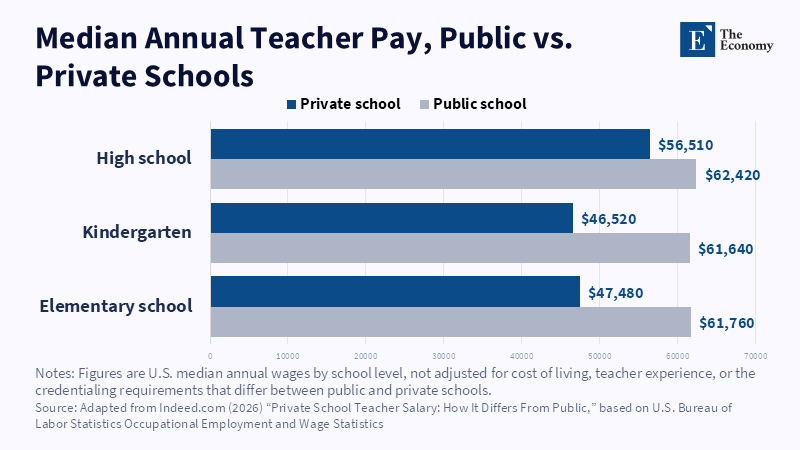
Figure: Private schools pay less than public schools at every grade level, despite competing more like a market, a sign that market pressure alone doesn't reward teaching skill either. Related Articles:
Read More
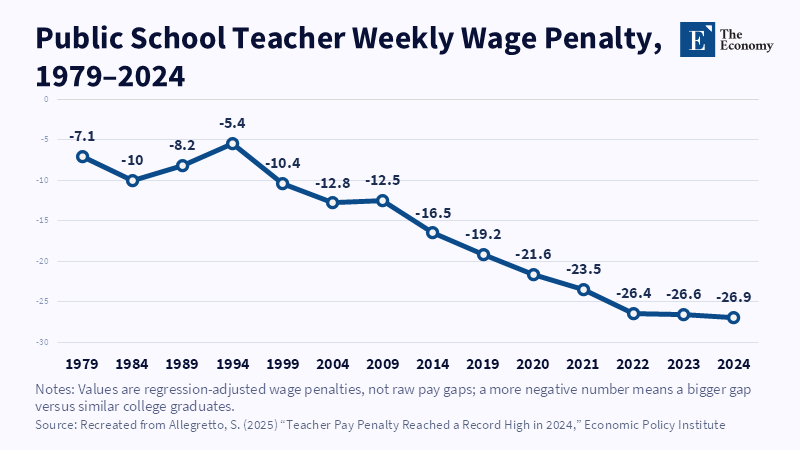
Figure: The gap between teacher pay and comparable college-graduate pay has widened almost every decade since the mid-1990s, hitting a record 26.9 percent in 2024. Related Articles:
Read More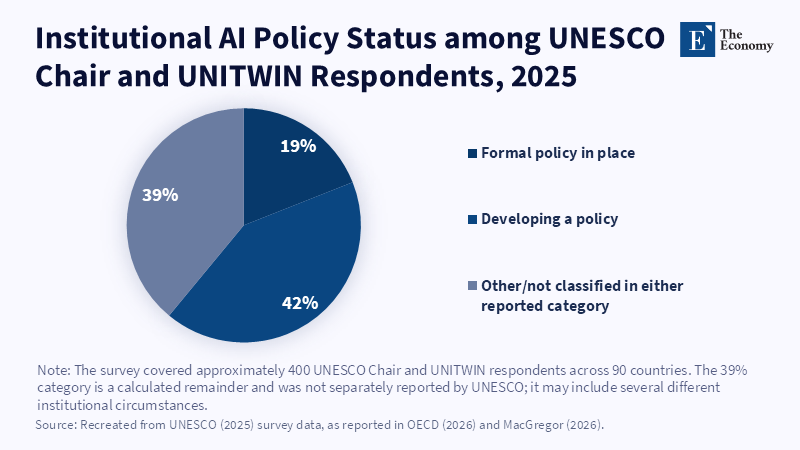
Figure: Policy development is common, but completed institutional policy remains the minority. Related Articles: AI in Higher Education: Why Univ
Read More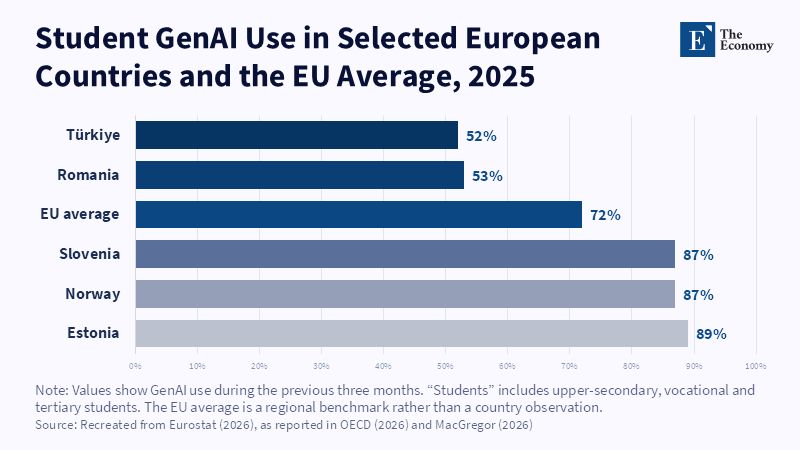
Figure: Adoption is widespread but uneven, with a 37-point gap between Estonia and Türkiye. Related Articles: AI in Higher Education: Why Univers
Read More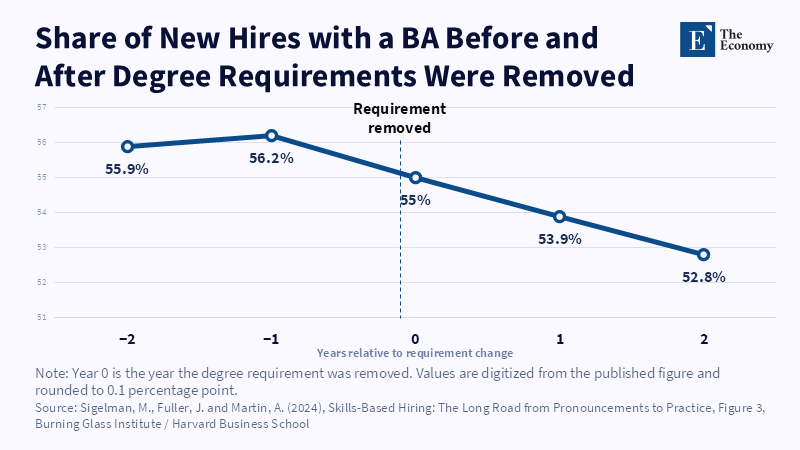
Note: The share of BA holders among new hires changed only modestly after degree requirements were removed. Related Articles: Superhuman Labor and the New Mean
Read More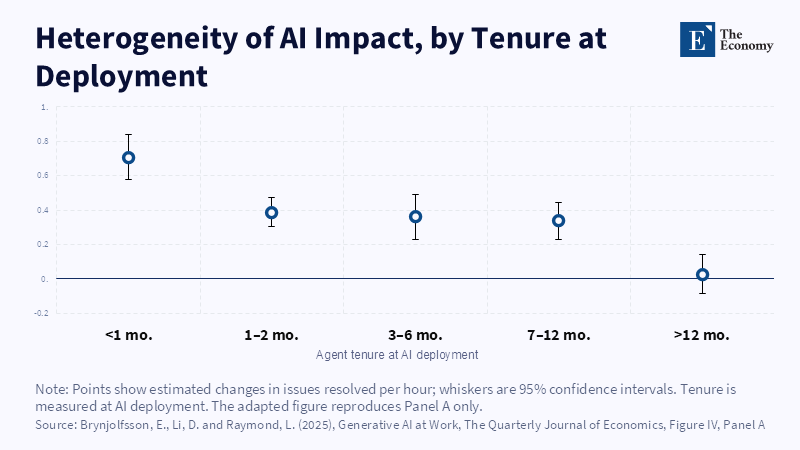
Note: AI produced the largest productivity gains among newer workers, with little measurable effect after a year of tenure. Related Articles: Superhuman Labor
Read More
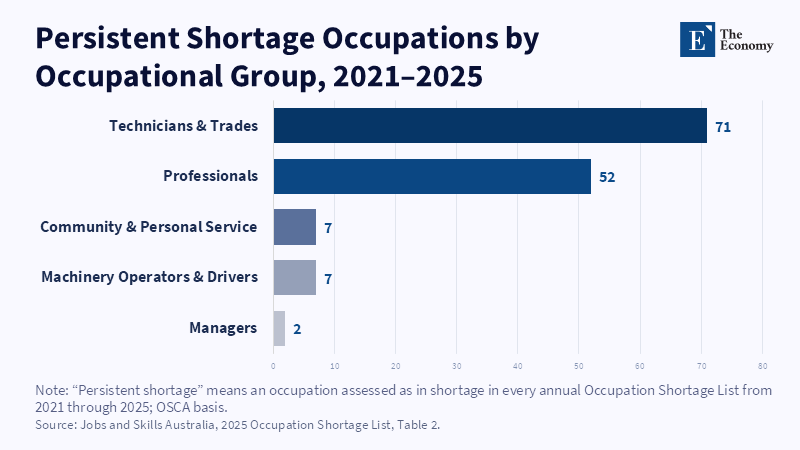
Note: Technicians, trades and professional occupations account for 123 of the 139 persistent shortages. Related Articles: Australian Student
Read More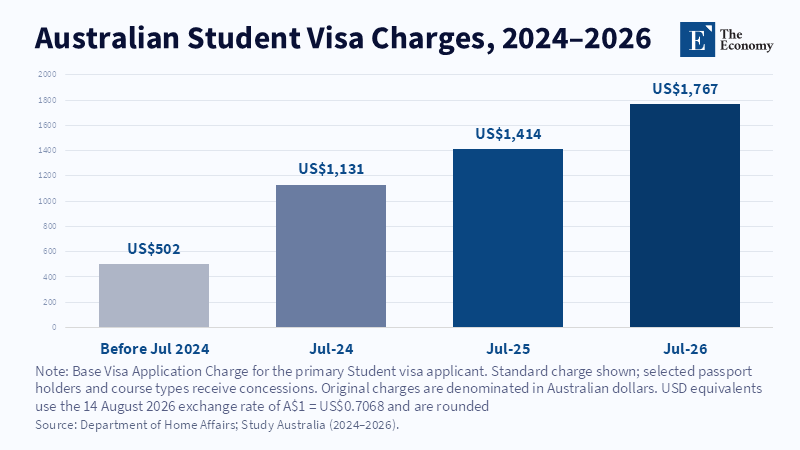
Note: The standard student visa charge more than tripled between 2024 and 2026. Related Articles: Australian Student Visa Fees Are Pricing Out
Read More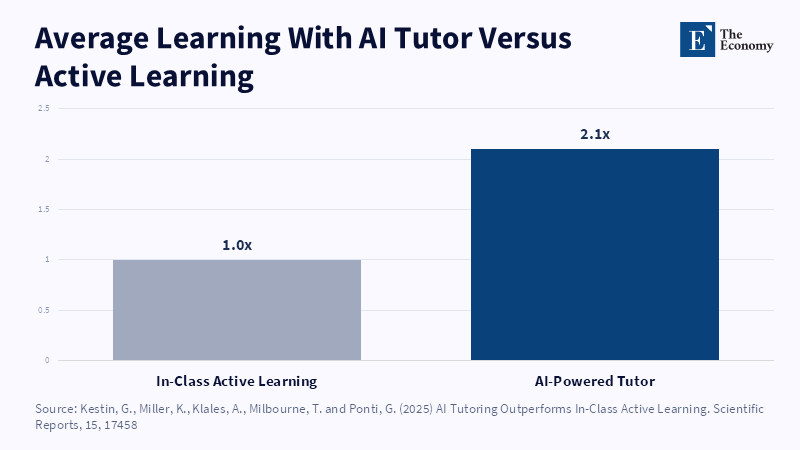
Note: A stronger result for the AI tutor than for the classroom but the gain shrinks once a plain non-AI active-learning comparison enters the picture. Related Articles:
Read More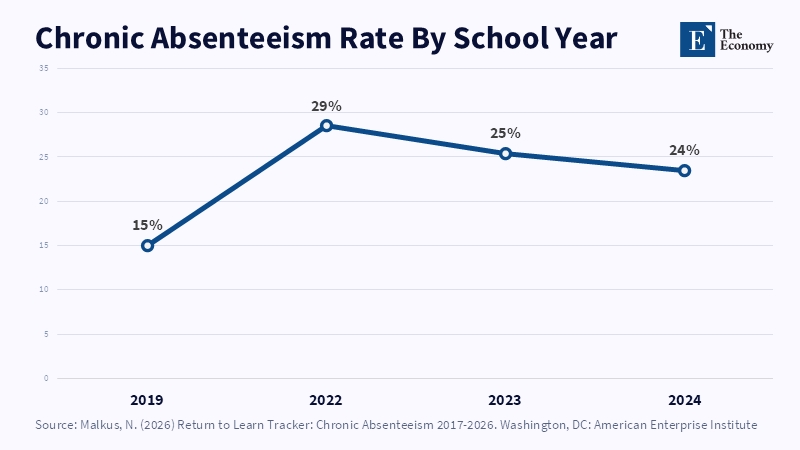
Note: Absenteeism never returned to its pre-pandemic floor, the backdrop against which Alpha School frames its case for AI-led instruction. Related Articles:
Read More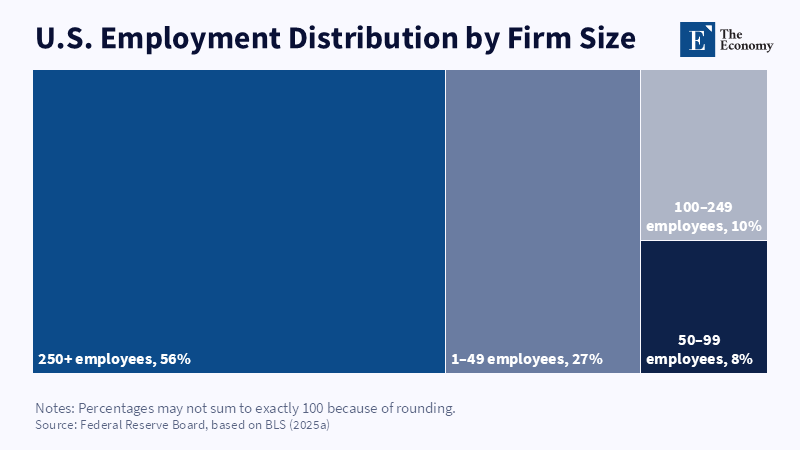
Large firms employ most U.S.
Read More