AI & Data
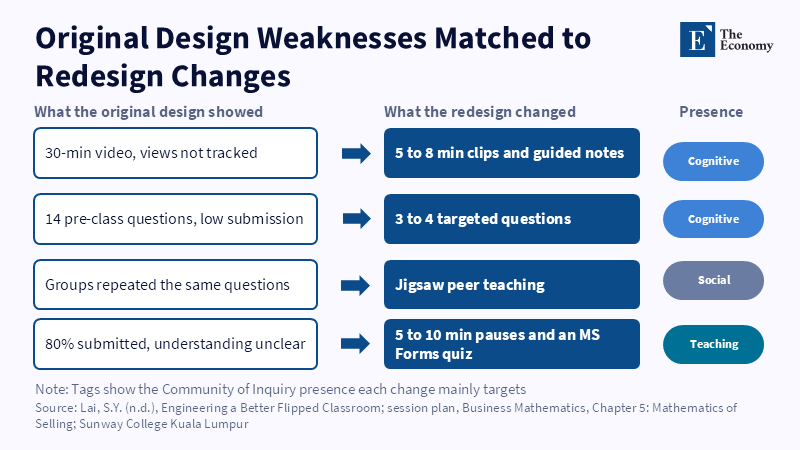
Figure: Each change answers a specific failure Lai observed, rather than adding technology for its own sake. Related articles: Redesigning
Read More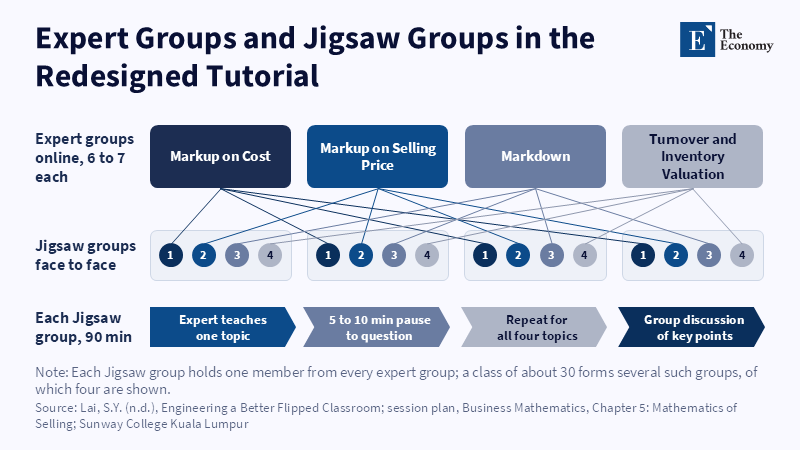
Figure: Each student arrives as the only expert on one topic, so no group can finish without hearing from every member. Related articles: Re
Read More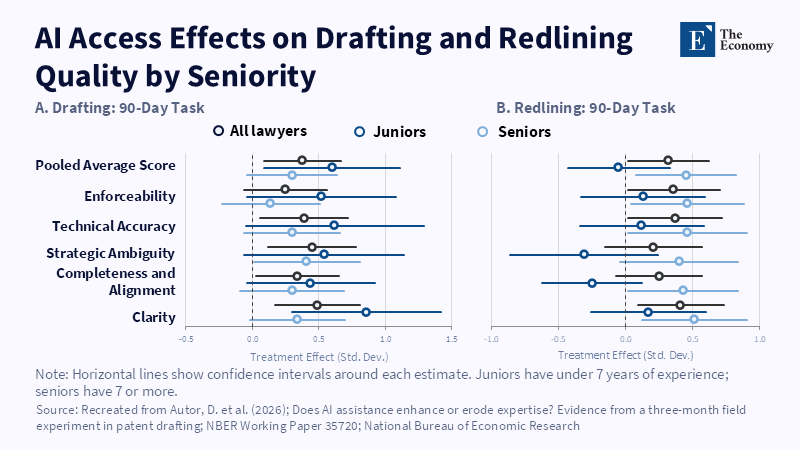
Figure 1: AI lifted junior drafts most, yet only seniors kept the gain without it. Related article: AI Tr
Read More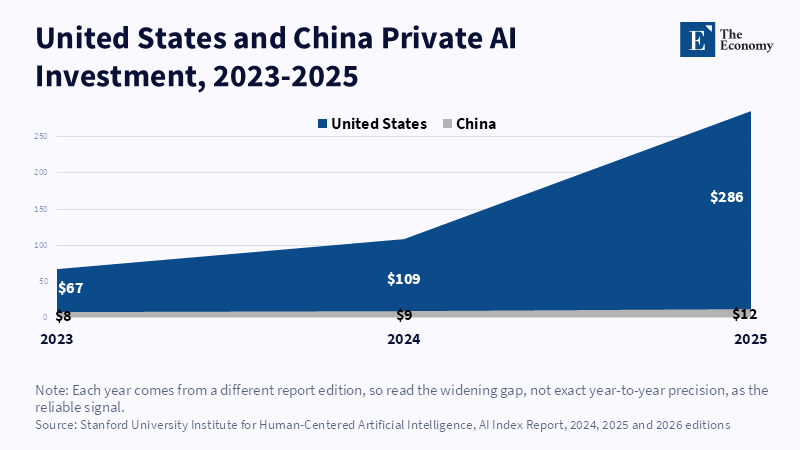
Figure 1. The US lead in private AI investment highlights the financial scale confronting middle powers.
Read More
Related article: Middle Powers and the Limits of Collective Agency in Artificial Intelligence
Read More







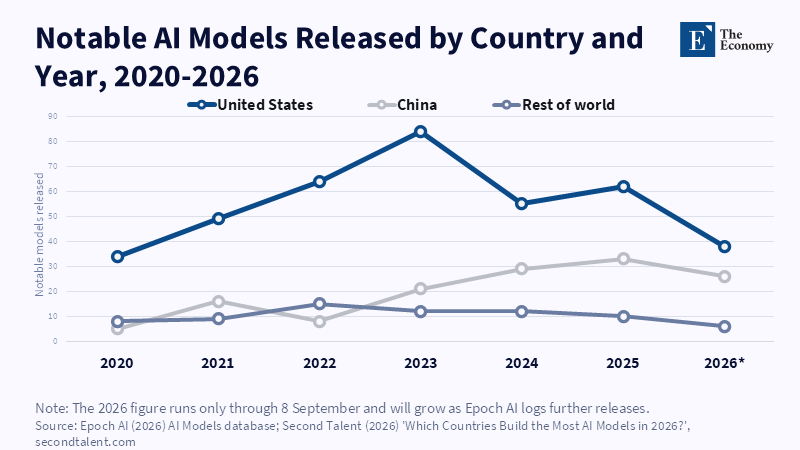
Figure 4. China’s notable model output expanded during 2023–2025, while the US remained ahead.
Read More
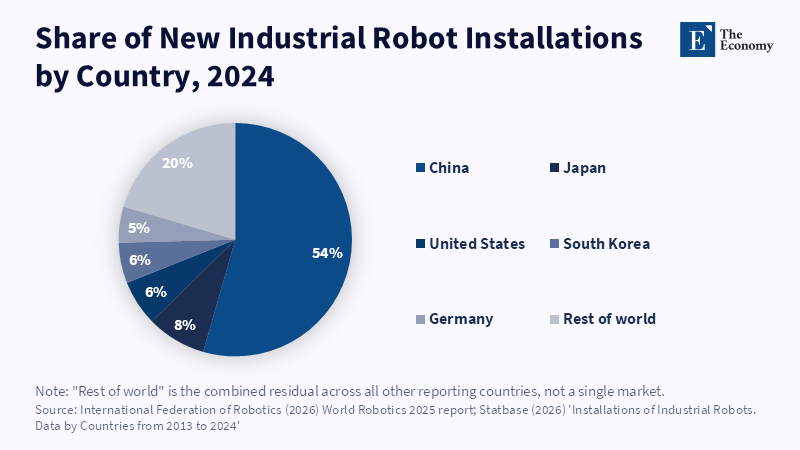
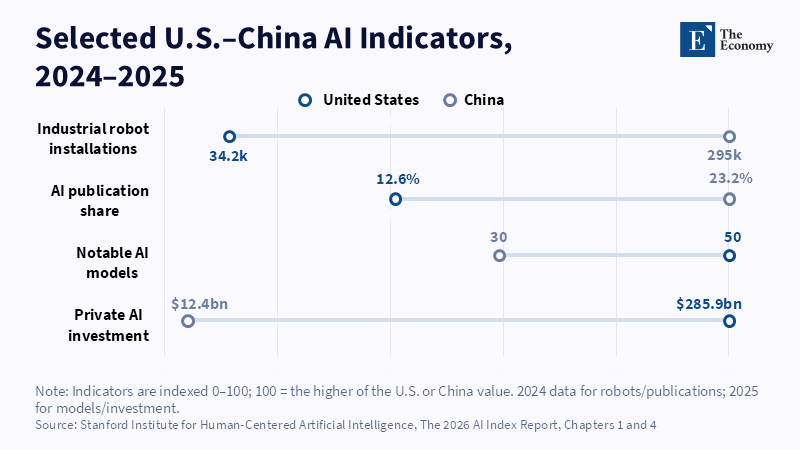
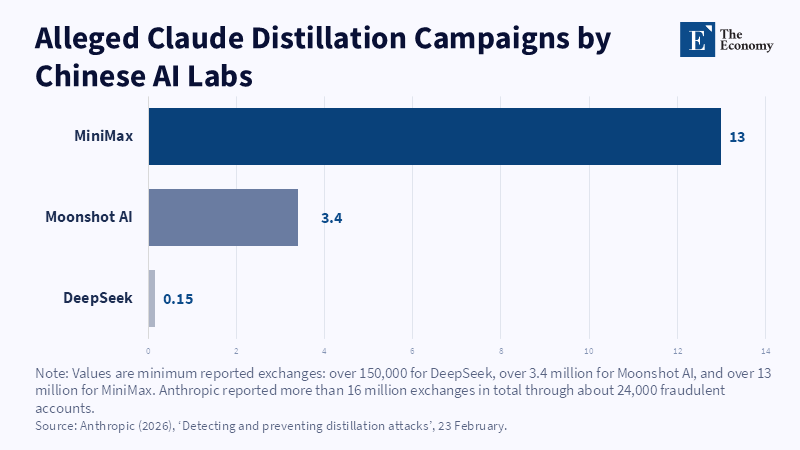
Figure 2: MiniMax accounted for nearly four-fifths of the exchanges Anthropic attributes to distillation, dwarfing Moonshot's and DeepSeek's shares.
Read More
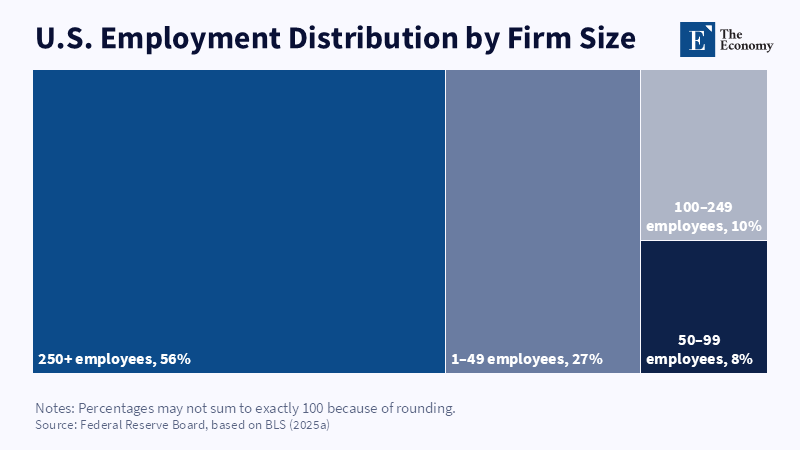
Large firms employ most U.S.
Read More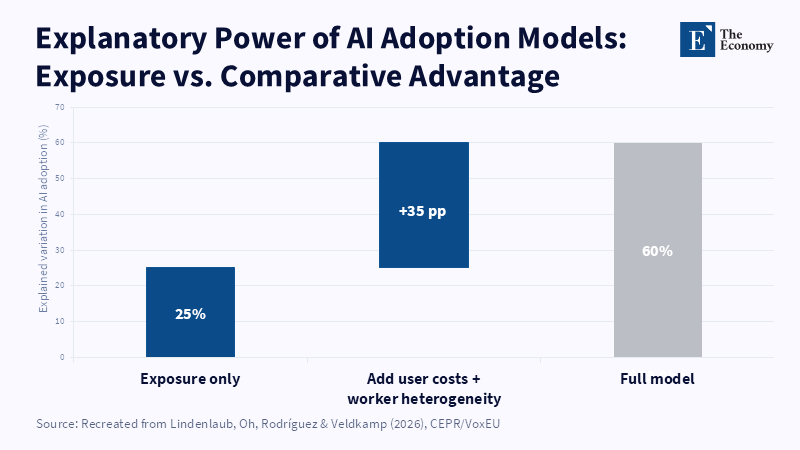
Accounting for costs and worker differences more than doubles the model’s explanatory power. Related Articles: Jevons Paradox and AI Adopti
Read More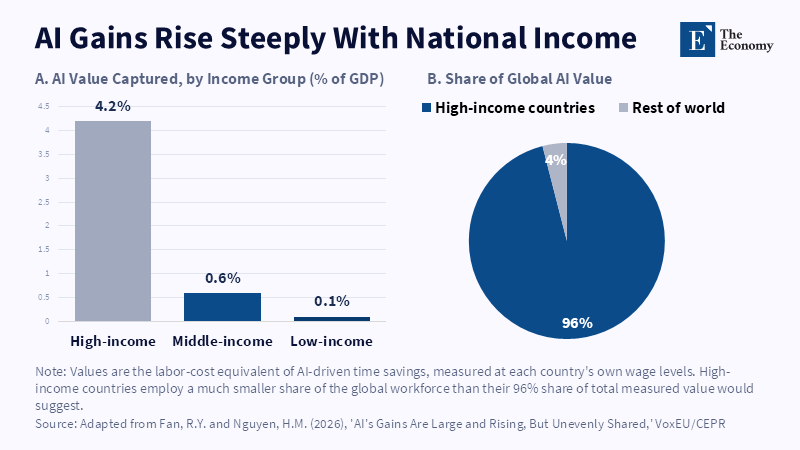
High-income economies capture overwhelmingly more measurable AI value. Related Articles: Korea’s AI Paradox: High Adoption, Low Productivity | The
Read More
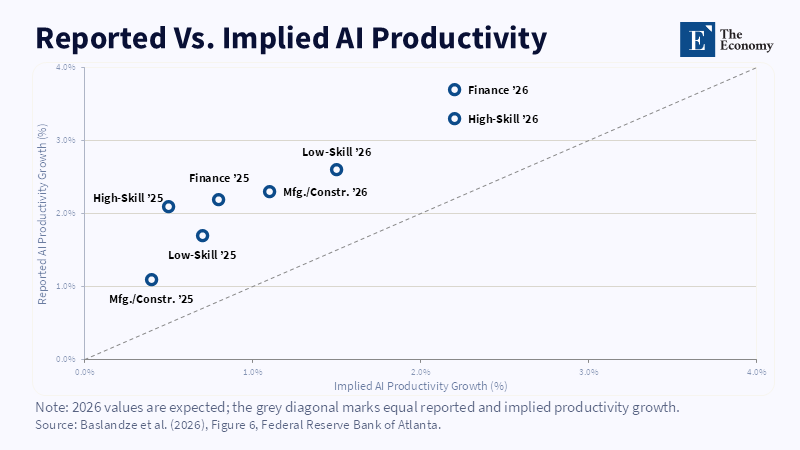
Reported AI productivity gains consistently exceed what firms' underlying revenue and employment data imply, across every sector surveyed. Related Articles:
Read More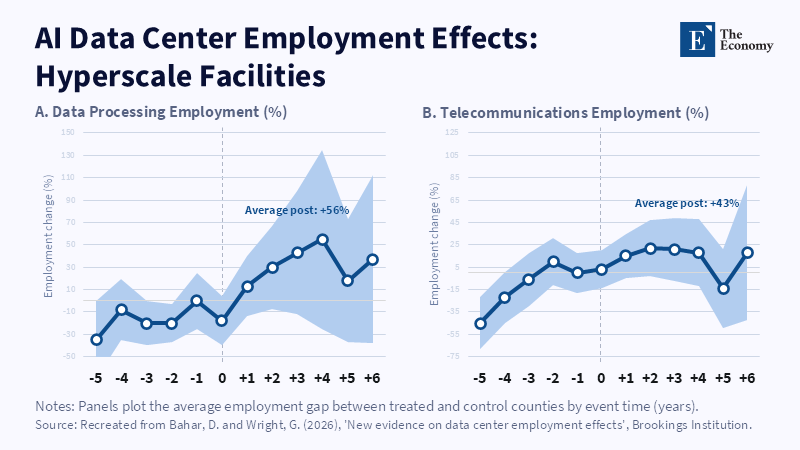
Data-processing and telecom employment climb through year four, dip, then recover by year six after a hyperscale opening. Related Articles: The
Read More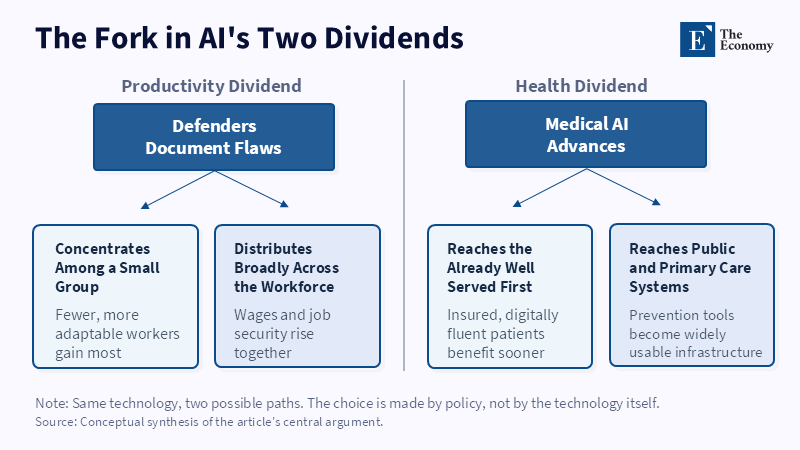
Same technology, two paths.
Read More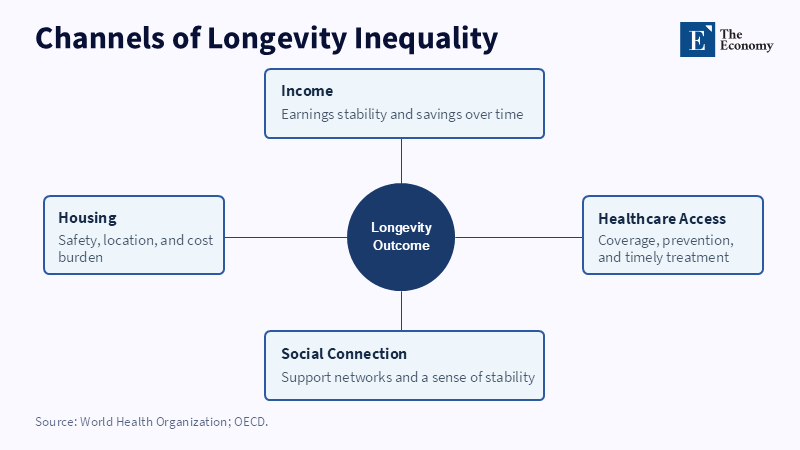
Longevity outcomes are built from four channels working together, not from any single event. Related Articles: [Longevity and Inequality] When
Read More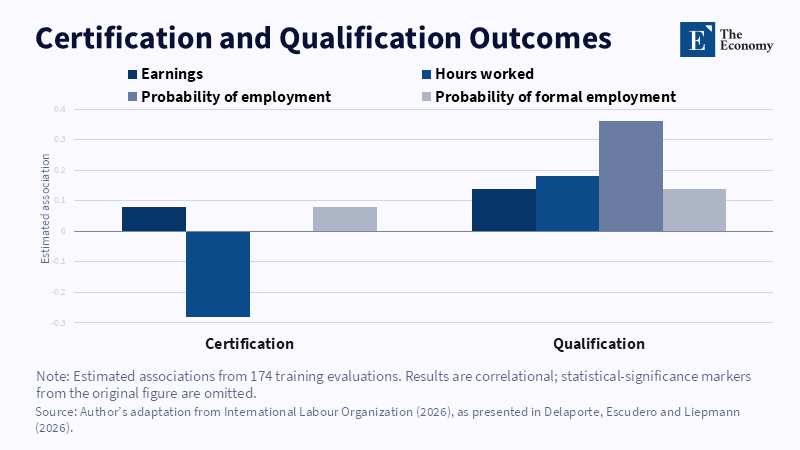
Qualifications show a stronger association with employment than certification alone. Related Articles: The Training Gap Behind the Rise of SuperHuman Labo
Read More